Data Interpretation Questions Practice Question and Answer
8 Q: Study the following graph and answer the question that follow.
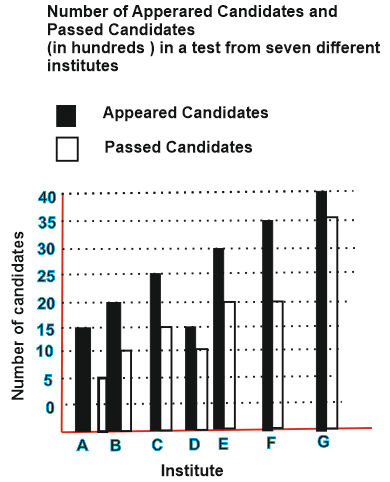 Number of candidates passed form institutes C and E together is approximately what percentage of the total number of candidates appeared from institutes A and G together?
1342 05d860ea0a08f7a4080524e93
5d860ea0a08f7a4080524e93 Number of candidates passed form institutes C and E together is approximately what percentage of the total number of candidates appeared from institutes A and G together?
- 172false
- 264true
- 354false
- 477false
- 568false
- Show AnswerHide Answer
- Workspace
- SingleChoice
Answer : 2. "64"
Q:Read the following graph carefully and answer the related questions-
Total number of students (in thousands) participating in comitative exam in various cities.
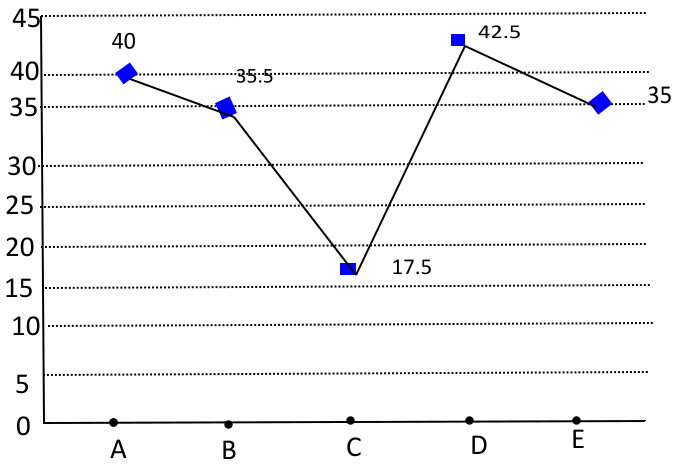
What is the average number of students appearing in competitive exam from all the states together?
1326 0602379a32dc71d4148a57f88
602379a32dc71d4148a57f88
- 133500false
- 23350false
- 317500false
- 4None of thesetrue
- Show AnswerHide Answer
- Workspace
- SingleChoice
Answer : 4. "None of these "
Q:The circle-graph given here shows the spending of a country on various sports during a particular year. Study the graph carefully and answer the question given below it.
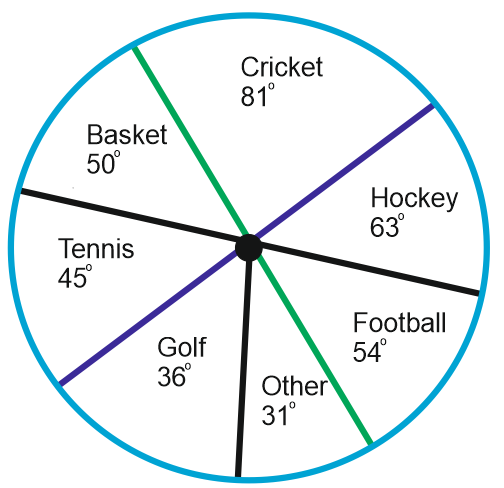
How much percent is less spent on Football than that on Cricket?
1317 05d70adc93b18207684daf2d9
5d70adc93b18207684daf2d9
- 1$$\left(22{2\over9} \right)\ $$%false
- 227%false
- 3$$33{1\over 3}\%$$true
- 430%false
- Show AnswerHide Answer
- Workspace
- SingleChoice
Answer : 3. "$$33{1\over 3}\%$$ "
Q: Study the following graph and answer the question that follow.
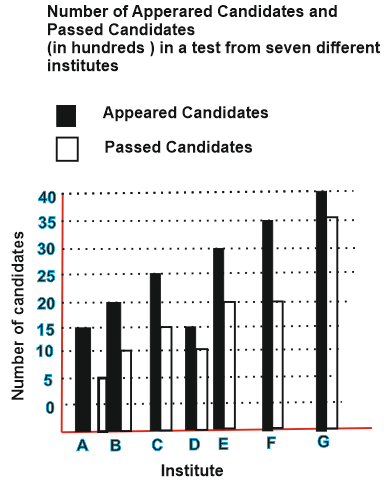 From which institute is the difference between the appeared candidates and passed candidates maximum?
1313 05d860d9bd0d7a00e4ecbb1b4
5d860d9bd0d7a00e4ecbb1b4 From which institute is the difference between the appeared candidates and passed candidates maximum?
- 1Bfalse
- 2Gfalse
- 3Dfalse
- 4Ftrue
- 5None of thesefalse
- Show AnswerHide Answer
- Workspace
- SingleChoice
Answer : 4. "F"
Q:Study the following bar chart and answer the questions carefully.
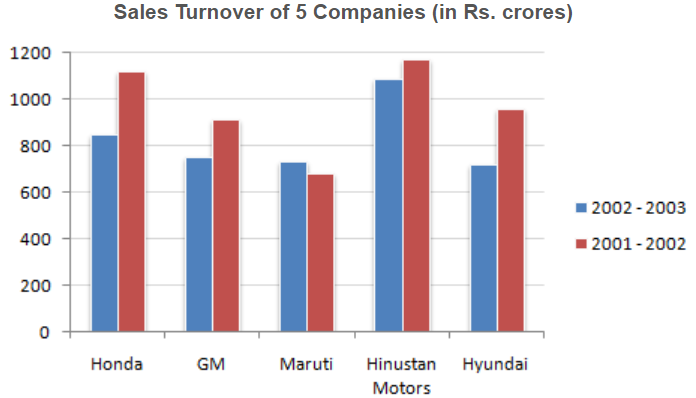
What is the absolute change in overall sales turnover of the five companies together between 2001 - 2002 and 2002 - 2003 ?
1310 05fd33b3cc46a213fc5c4fc25
5fd33b3cc46a213fc5c4fc25
- 1712.43true
- 2142.48false
- 3683.53false
- 4655.56false
- 5None of thesefalse
- Show AnswerHide Answer
- Workspace
- SingleChoice
Answer : 1. "712.43"
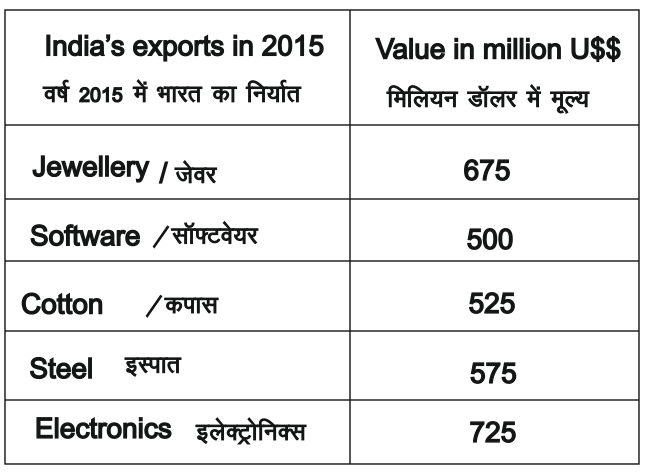
Q: Refer the below data table and answer the following question.
Jewellery was what percent of total exports?
1299 05f0e85011090a058653eba82
5f0e85011090a058653eba82Jewellery was what percent of total exports?

- 122.5 %true
- 225 %false
- 320 %false
- 427.5 %false
- Show AnswerHide Answer
- Workspace
- SingleChoice
Answer : 1. "22.5 %"
Q:Direction: Given bar graph shows the number of plain books and lined books (in hundreds) available at three different stores and the table shows the percentage of total books (Plain + lined) that was sold by different stores.
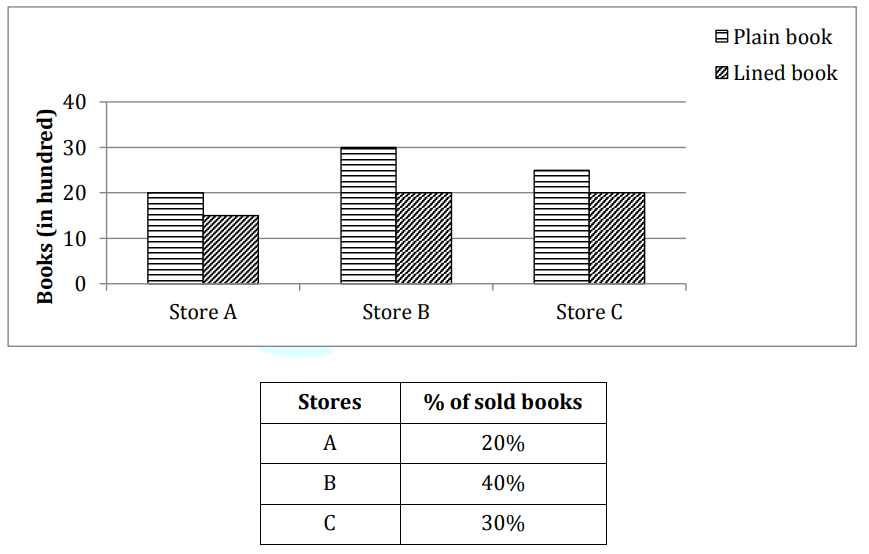
Unsold books of store A is approximately is what percent more or less than total unsold books of store B and C together.
1298 0603f3cefe759ac364c902aee
603f3cefe759ac364c902aee
- 159%false
- 252%false
- 348%false
- 454%true
- 557%false
- Show AnswerHide Answer
- Workspace
- SingleChoice
Answer : 4. "54% "
Q:Directions: Study the following pie chart carefully and answer the questions given beside.
The following pie chart gives the information about breakup of six different categories of workers in a company.
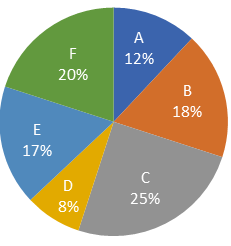
In category A, the ratio of male workers to female workers is 2 : 3. The number of female workers in category A is what percentage of the total number of workers in category F?
1297 0601a5493552e5f41f7b07ea7
601a5493552e5f41f7b07ea7The following pie chart gives the information about breakup of six different categories of workers in a company.

- 135.5%false
- 238%false
- 337.5%false
- 436%true
- Show AnswerHide Answer
- Workspace
- SingleChoice

