Data Interpretation Questions Practice Question and Answer
8 Q:Direction (94-98): Study the following table to answer the given questions.
Centre and Post-wise Numbered of candidate
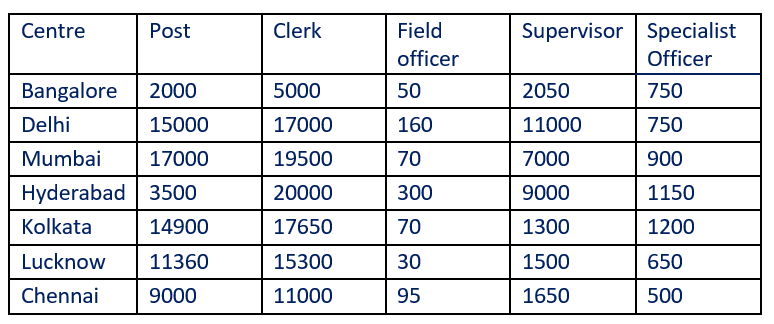
Which centre has the highest number of candidates?
1287 05da400f4d69109270473a035
5da400f4d69109270473a035Centre and Post-wise Numbered of candidate

- 1Delhifalse
- 2Kolkatafalse
- 3Hyderabadfalse
- 4Mumbaitrue
- 5None of thesefalse
- Show AnswerHide Answer
- Workspace
- SingleChoice
Answer : 4. "Mumbai"
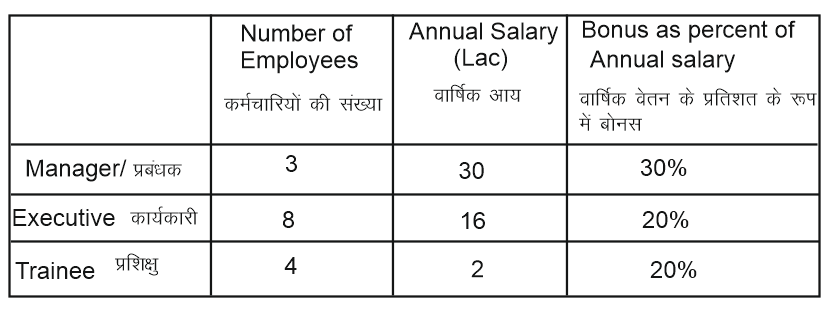
Q: Refer the below data table and answer the following questions.
What is the average bonus ( in rupees)?
1286 05f0e7eaa1090a058653e9553
5f0e7eaa1090a058653e9553What is the average bonus ( in rupees)?

- 1126000false
- 25419994false
- 3361333true
- 4None of thesefalse
- Show AnswerHide Answer
- Workspace
- SingleChoice
Answer : 3. "361333"
Q:Study the given graph and answer the question that follows.
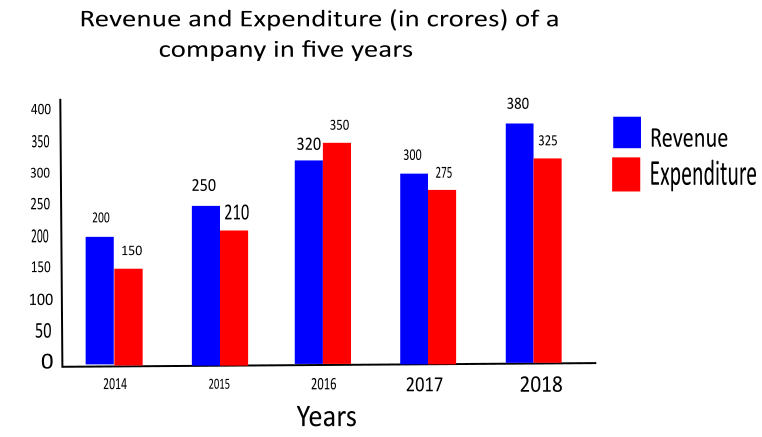
What is the ratio of the total expenditure in 2015 and 2016 to the total revenue of the company in 2016 and 2018?
1280 05fbf78fa4f2f6c622be787d2
5fbf78fa4f2f6c622be787d2
- 16 : 7false
- 219: 20false
- 34 : 5true
- 411 : 20false
- Show AnswerHide Answer
- Workspace
- SingleChoice
Answer : 3. "4 : 5"
Q: In 2010, the population of ‘Y’ and ‘V’ increase by 10% each and the percentage of population below poverty line remains unchanged for all the villages. If in 2009, the population of village Y was 30,000 then the below poverty line population of village ‘V’ in 2010 is-
1277 15d7f2970fb24f9020863a16b
5d7f2970fb24f9020863a16b- 111250false
- 212760true
- 313140false
- 413780false
- Show AnswerHide Answer
- Workspace
- SingleChoice
Answer : 2. "12760"
Q:A bar graph showing the height of six mountain peaks. Study the bar graph and answer the following Questions.
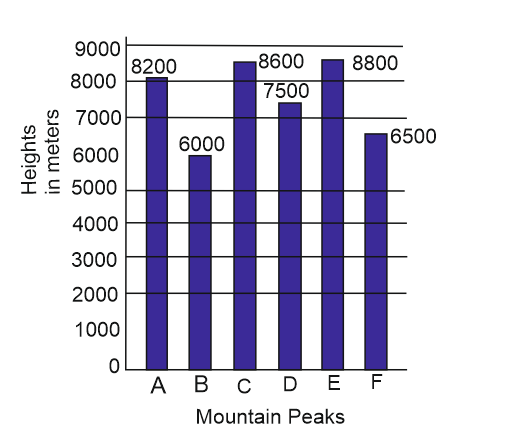
The average height of all the peak (in meters) is
1260 05f06deffb13c2d244adaaeee
5f06deffb13c2d244adaaeee
- 17600true
- 27601.5false
- 37599.5false
- 47610false
- Show AnswerHide Answer
- Workspace
- SingleChoice
Answer : 1. "7600"
Q:Direction : Given here is a multiple bar diagram of the scores of four players in two innings. Study the diagram and answer the questions.
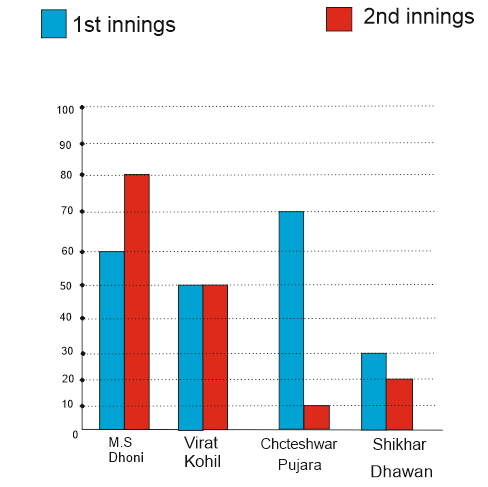
The average runs of two innings of the player who scored highest in average are :
1239 05da82e7ab247ec0cc95f2a93
5da82e7ab247ec0cc95f2a93
- 170true
- 280false
- 385false
- 475false
- Show AnswerHide Answer
- Workspace
- SingleChoice
Answer : 1. "70 "
Q:The circle-graph given here shows the spending of a country on various sports during a particular year. Study the graph carefully and answer the question given below it.
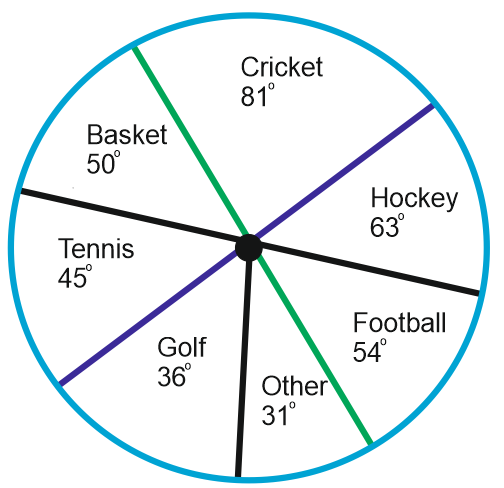
If the total amount spent on sports during the year was Rs. 2 crores, the amount spent on cricket and Hockey together was:
1238 05d70afe4eb96471d6f364689
5d70afe4eb96471d6f364689
- 1Rs. 8,00,000false
- 2Rs. 80,00,000true
- 3Rs. 1,20,00,000false
- 4Rs. 1,60,00,000false
- Show AnswerHide Answer
- Workspace
- SingleChoice
Answer : 2. "Rs. 80,00,000"
Q:The pie chart below represents the instruments played by students of a school. Read the chart and answer the following questions based on it.
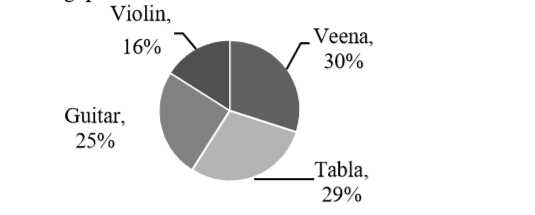
The ratio of students who play Guitar to Violin
1236 05eba32028e4fa473bcb7f6b9
5eba32028e4fa473bcb7f6b9
- 15:4false
- 25:6false
- 325:16true
- 48:15false
- Show AnswerHide Answer
- Workspace
- SingleChoice


