Data Interpretation Questions Practice Question and Answer
8 Q:Directions : Given line graph shows the data of male & female population in 5 different cities. Read the data carefully and answer the questions.
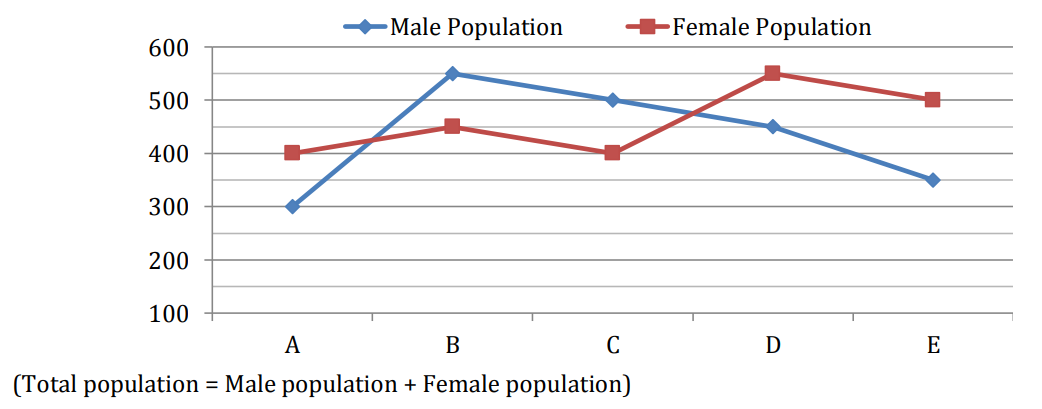
If in city A, the ratio of male graduates to female graduates is 3 : 4 and total graduates in the city are 70% of total population. Find population of females who are not graduate.
1202 060408834e759ac364c93f3c5
60408834e759ac364c93f3c5
- 1120true
- 250false
- 390false
- 470false
- 5135false
- Show AnswerHide Answer
- Workspace
- SingleChoice
Answer : 1. "120"
Q:Direction: The following graph shows the number of boys and girls in Class V, Class VI, Class VII and Class VIII. Study the graph and answer the question.
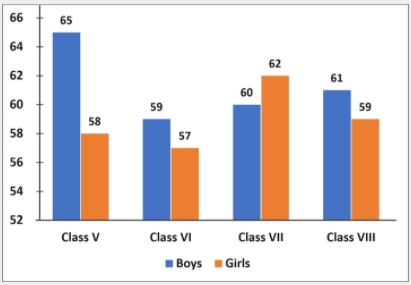
Which class has the maximum number of students?
1200 06037520124cd273bc4f4ac9d
6037520124cd273bc4f4ac9d
- 1Class VIfalse
- 2Class VIIIfalse
- 3Class Vtrue
- 4Class VIfalse
- Show AnswerHide Answer
- Workspace
- SingleChoice
Answer : 3. "Class V"
Q:Direction: Study the pie chart carefully and answer the given questions. The pie chart shows the percentage breakup of students in different classes from VI to X in the year 2017
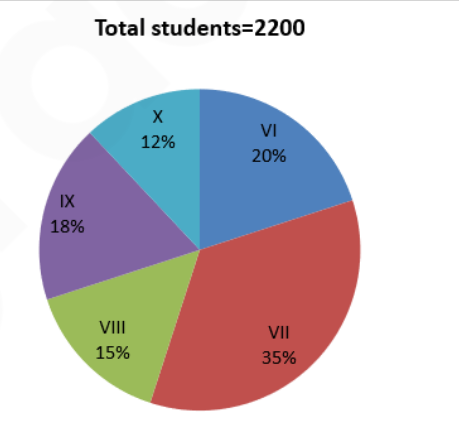
The total number of students study in class VI and class IX together is approximate what percentage more than that of the total number of students study in class X?
1199 060a256afb1d2440614b9fabb
60a256afb1d2440614b9fabb
- 1189%false
- 277%false
- 3125%false
- 4280%false
- 5217%true
- Show AnswerHide Answer
- Workspace
- SingleChoice
Answer : 5. "217%"
Q:Direction: Given bar graph shows the number of plain books and lined books (in hundreds) available at three different stores and the table shows the percentage of total books (Plain + lined) that was sold by different stores.
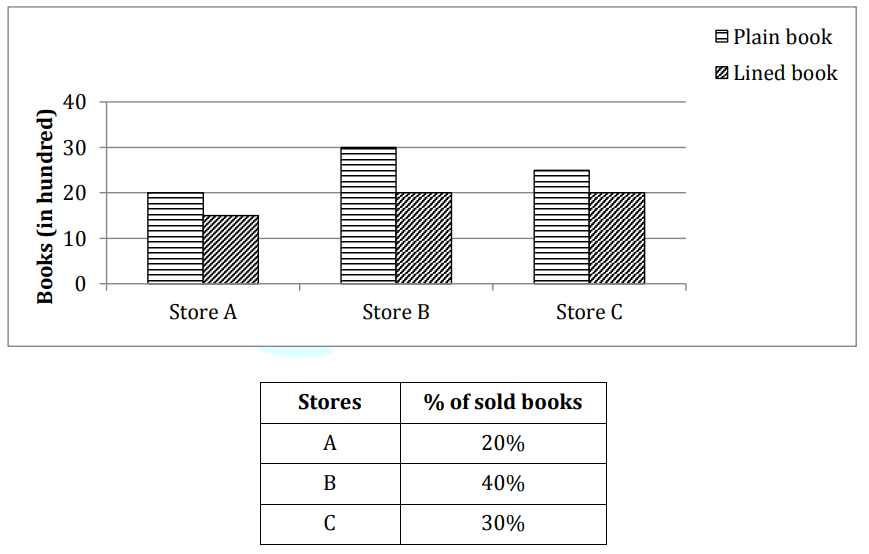
The ratio of sold plain and lined books for store C is 5 : 4 and for store B is 3 : 2. Then find the total plain books sold by these two stores together?
1197 0603f3c5f251bf6540042e08d
603f3c5f251bf6540042e08d
- 11950true
- 21975false
- 31750false
- 41825false
- 51850false
- Show AnswerHide Answer
- Workspace
- SingleChoice
Answer : 1. "1950 "
Q:The circle-graph given here shows the spending of a country on various sports during a particular year. Study the graph carefully and answer the question given below it.
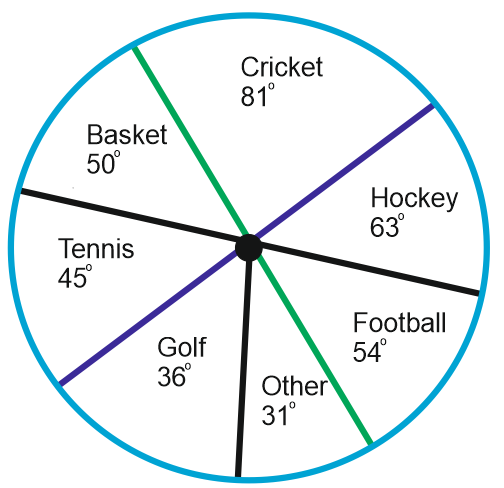
How much percent is more spent on Hockey than that on Golf?
1188 05d70aacf9004b376a58bd1b3
5d70aacf9004b376a58bd1b3
- 127 %false
- 235 %false
- 337.5 %false
- 475 %true
- Show AnswerHide Answer
- Workspace
- SingleChoice
Answer : 4. "75 %"
Q:Study the table and answer the questions and give answer the following questions.

Supposing that there were 40 students in sciences in the year 2009. How much total of marks did they receive combined together?
1186 05eec85e6eee45c3b837fa9ef
5eec85e6eee45c3b837fa9ef
- 12800false
- 22720true
- 32560false
- 43000false
- Show AnswerHide Answer
- Workspace
- SingleChoice
Answer : 2. "2720"
Q:Direction: Study the double bar graph given below and answer the questions.
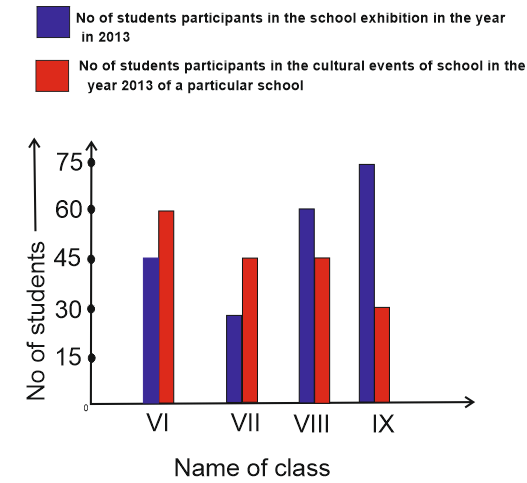
The class having maximum number of participants in exhibitions:
1174 05d932154c263b979273f36ac
5d932154c263b979273f36ac
- 1Class IXtrue
- 2Class VIIIfalse
- 3Class VIIfalse
- 4Class VIfalse
- Show AnswerHide Answer
- Workspace
- SingleChoice
Answer : 1. "Class IX"
Q:Study the graph carefully and answer the following questions.
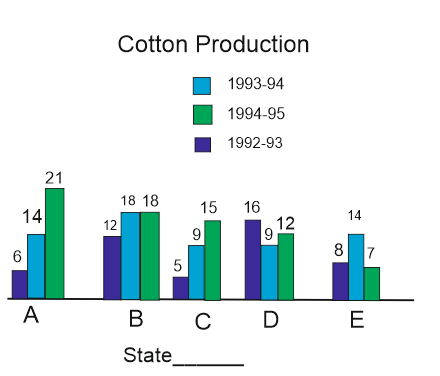
How many state showing above average production in 1992-93 showed below average production in 1993-94 ?
1169 05f15635deddbc50839d5259a
5f15635deddbc50839d5259a
- 14false
- 22true
- 33false
- 41false
- Show AnswerHide Answer
- Workspace
- SingleChoice

