Data Interpretation Questions Practice Question and Answer
8 Q:The circle-graph given here shows the spending of a country on various sports during a particular year. Study the graph carefully and answer the question given below it.
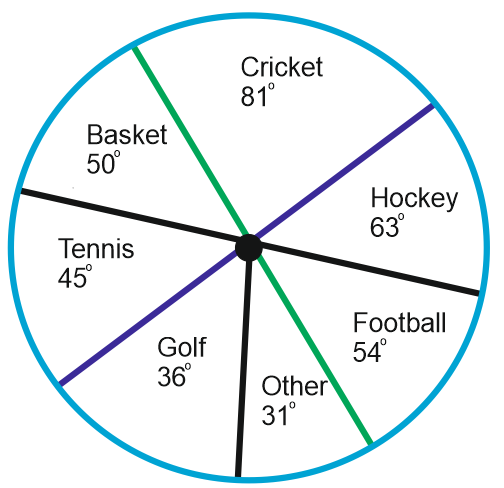
If the total amount spent on sports during the year be Rs. 1,80,00,000 the amount spent on Basketball exceeds that on Tennis by:
1415 05d70b20260d0a53645a46a8f
5d70b20260d0a53645a46a8f
- 1Rs. 2,50,000true
- 2Rs. 3,60,000false
- 3Rs. 3,75,000false
- 4Rs. 4,10,000false
- Show AnswerHide Answer
- Workspace
- SingleChoice
Answer : 1. "Rs. 2,50,000"
Q:The following line graph gives the percentage of the number of candidates who qualified an examination out of the total number of candidates who appeared for the examination over a period of seven years from 1994 to 2000.
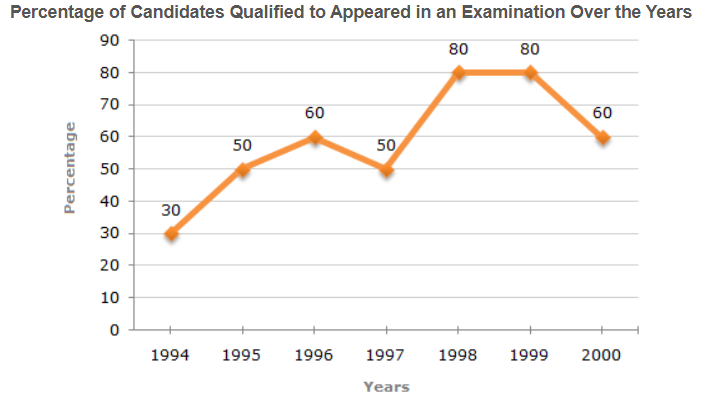
The difference between the percentage of candidates qualified to appeared was maximum in which of the following pairs of years?
1411 05e7998fd8560ba13b02734cd
5e7998fd8560ba13b02734cd
- 11994 and 1995false
- 21997 and 1998true
- 31998 and 1999false
- 41999 and 2000false
- 5None of thesefalse
- Show AnswerHide Answer
- Workspace
- SingleChoice
Answer : 2. "1997 and 1998"
Q: Compared to the month of January, what is the percentage of decrease in accidents in the month of February?
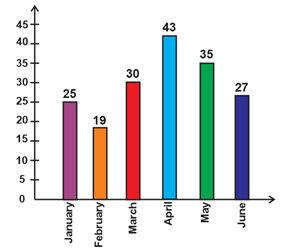
1402 05d775f45a1321a5b0b595150
5d775f45a1321a5b0b595150
- 125false
- 224true
- 330false
- 427false
- Show AnswerHide Answer
- Workspace
- SingleChoice
Answer : 2. "24"
Q:Direction : Given here is a multiple bar diagram of the scores of four players in two innings. Study the diagram and answer the questions.
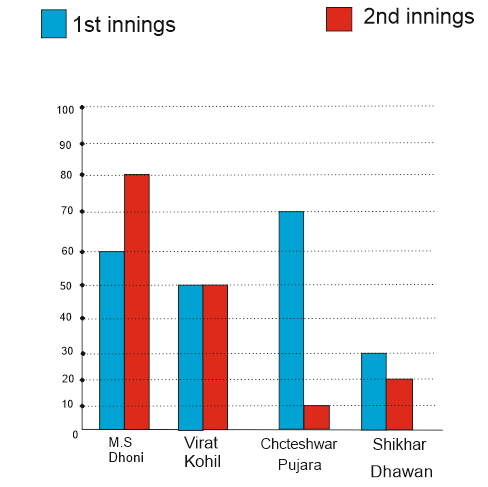
The total scores in the first innings contributed by the four players is :
1401 05da82f6db247ec0cc95f2b72
5da82f6db247ec0cc95f2b72
- 1190false
- 2210true
- 3220false
- 4200false
- Show AnswerHide Answer
- Workspace
- SingleChoice
Answer : 2. "210 "
Q:Study the following pie-diagrams carefully and answer the question given below it.
PERCENTAGE COMPOSITION OF HUMAN BODY
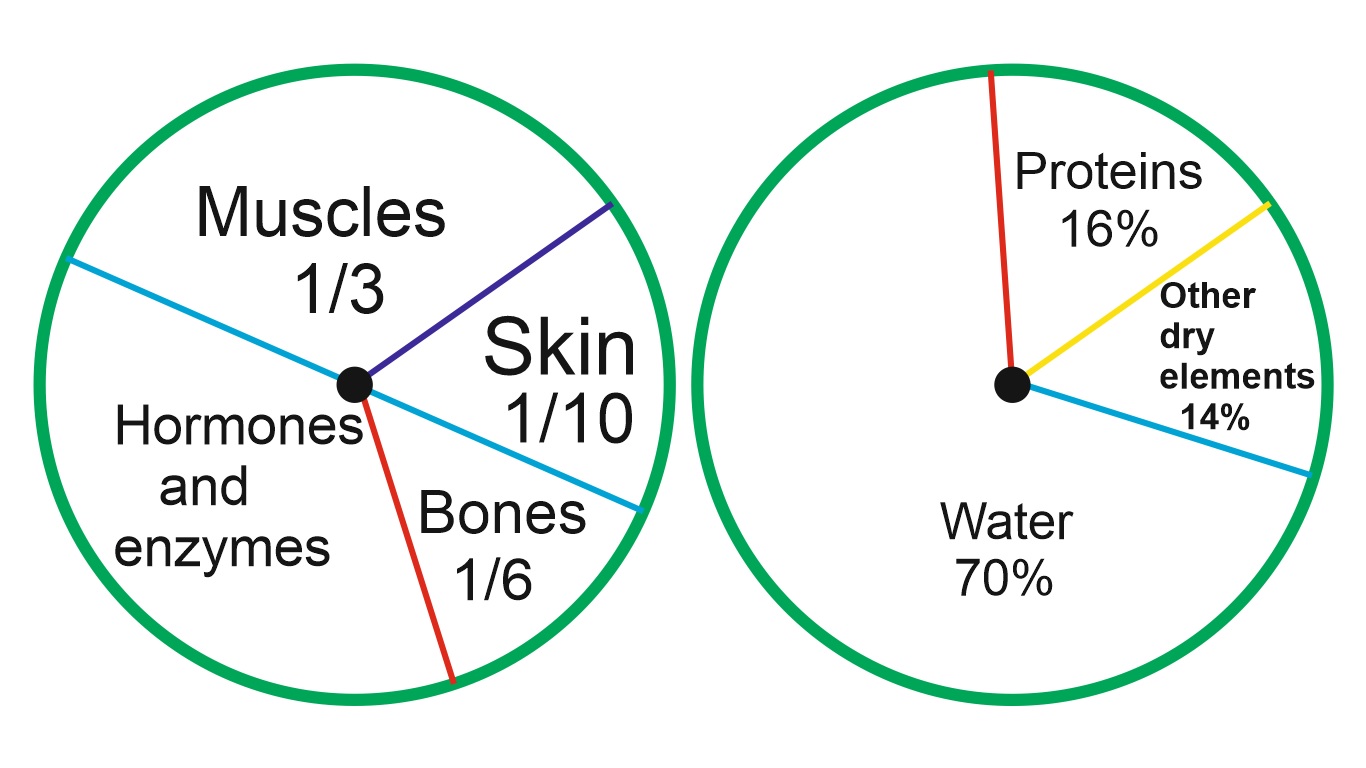
What percent of the total weight of a human body is equivalent to the weight of the proteins in the skin in a human body?
1386 05dcc07f1e9d33d6509bf4c65
5dcc07f1e9d33d6509bf4c65PERCENTAGE COMPOSITION OF HUMAN BODY

- 10.016false
- 21.6true
- 30.16false
- 4Data inadequatefalse
- Show AnswerHide Answer
- Workspace
- SingleChoice
Answer : 2. "1.6"
Q:Directions: The bar graph given below shows the spending of family income on various items and savings during 1993. Observe the graph and answer the following questions:
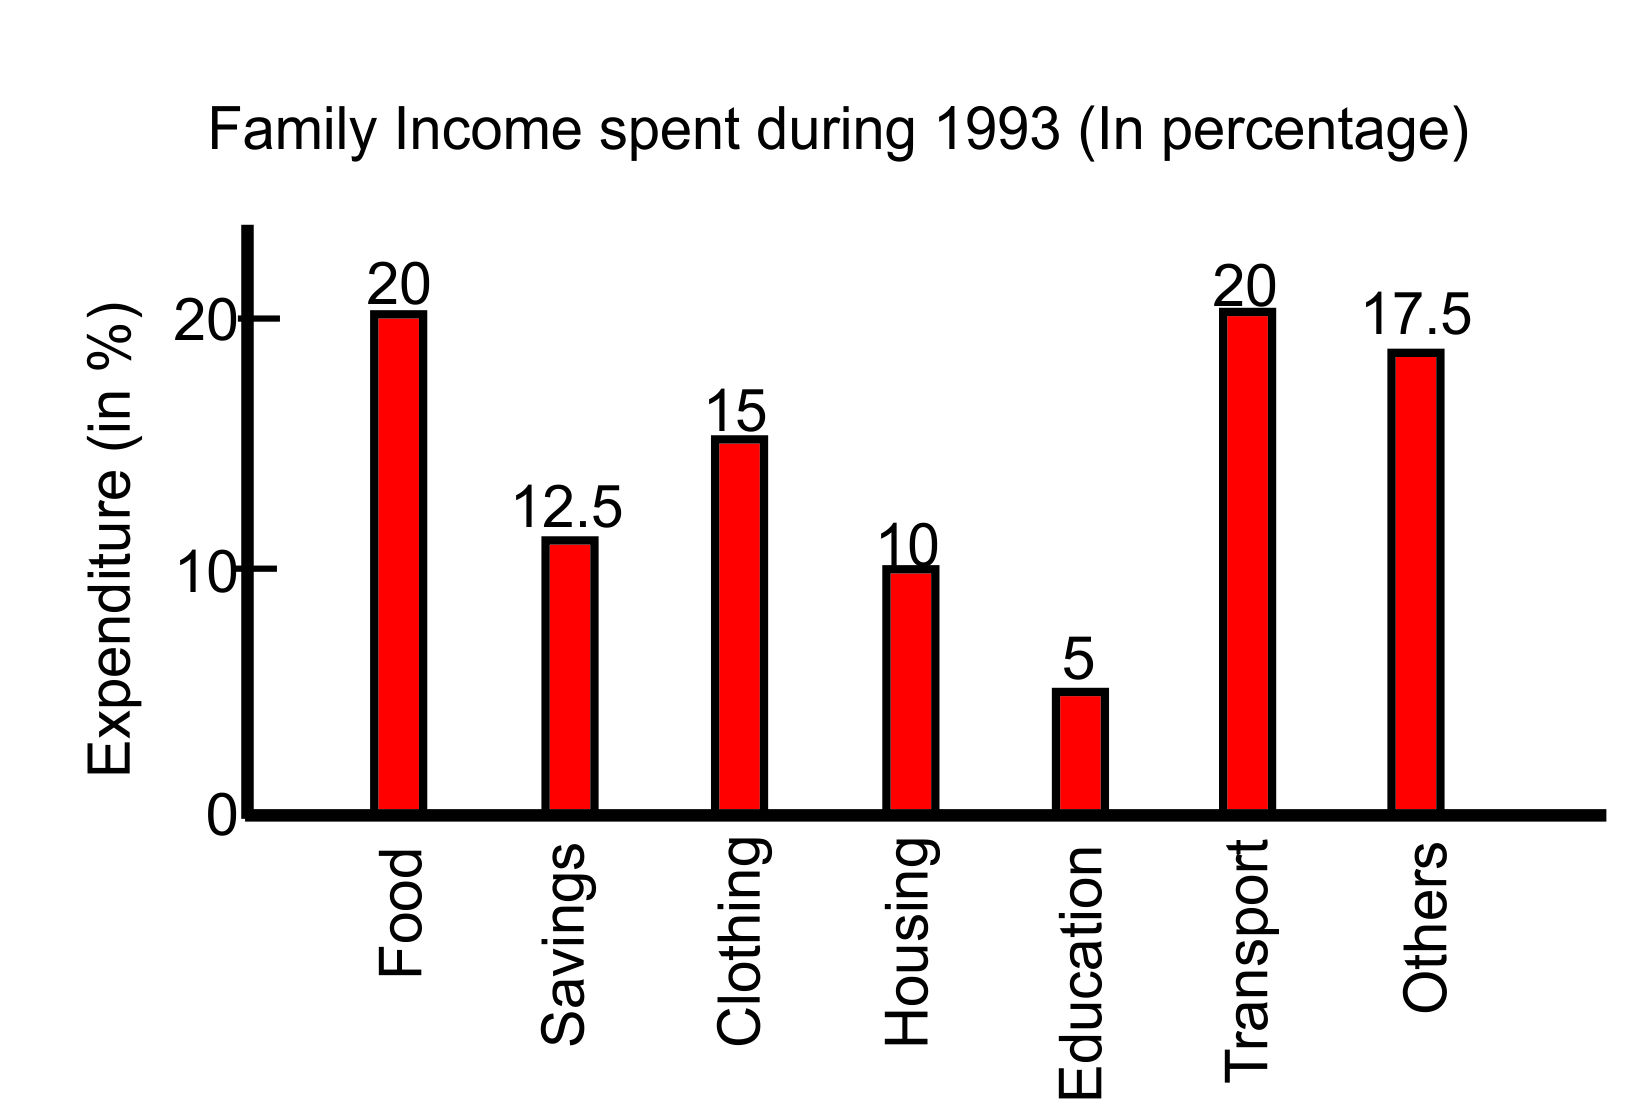
If the total income of the family during 1993 was ₹ 100000, the savings of the family in 1993 was:
1383 05def3e2d6d799a05c00a5ec8
5def3e2d6d799a05c00a5ec8
- 1₹1,750false
- 2₹20,000false
- 3₹12,500true
- 4₹50,000false
- Show AnswerHide Answer
- Workspace
- SingleChoice
Answer : 3. "₹12,500 "
Q:Study the graph carefully and answer the following questions.
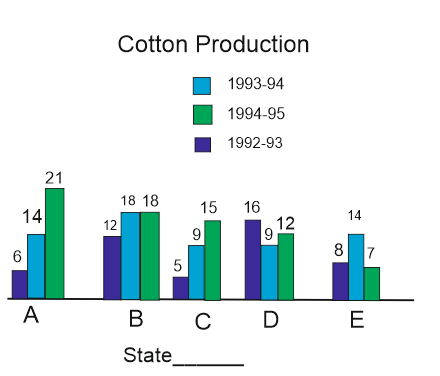
The production of State D in 1993-94 is how many times its production in 1994-95 ?
1376 05f1562f0cf79540a75340301
5f1562f0cf79540a75340301
- 11.33false
- 20.75true
- 30.56false
- 41.77false
- Show AnswerHide Answer
- Workspace
- SingleChoice
Answer : 2. "0.75"
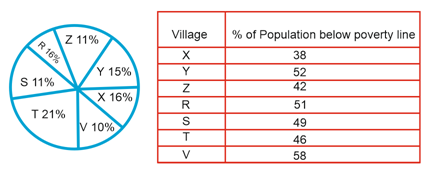
Q: Direction: The following pie chart shows proportion of the population of seven villages n 2009. Study the pie chart and answer question that follows:
If the population of village ‘R’ is 32000, then the below poverty line population of village ‘Y’ is
1358 05d7f28b67f06bc6981e06ecc
5d7f28b67f06bc6981e06eccIf the population of village ‘R’ is 32000, then the below poverty line population of village ‘Y’ is

- 114100false
- 215600true
- 316500false
- 417000false
- Show AnswerHide Answer
- Workspace
- SingleChoice

