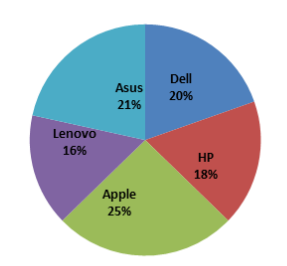
The following pie chart shows the percentage-wise distribution of the nominal sales figures of laptops of five different companies during a given period.
If the total sales of all the companies taken together is ₹55,00,000, then find the difference between the sales of HP and Apple.
5 762 643d1aba2d621da11696d46d
Q:
The following pie chart shows the percentage-wise distribution of the nominal sales figures of laptops of five different companies during a given period.
If the total sales of all the companies taken together is ₹55,00,000, then find the difference between the sales of HP and Apple.
- 1₹ 3,65,000false
- 2₹ 7,50,000false
- 3₹ 4,25,000false
- 4₹ 3,85,000true
- Show Answer
- Workspace
- Discuss


