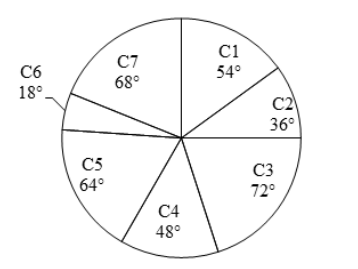
The following pie chart shows the sectors representing the shares of the number of electric buses manufactured in each of 7 different colours in a given year in terms of the central angles (in degrees) with respect to the total number of buses manufactured during that year of all the 7 colours taken together.
What is the difference in the percentage shares of buses of C4 and C6? [Give your answer correct to 2 decimal places.]
5Q:
The following pie chart shows the sectors representing the shares of the number of electric buses manufactured in each of 7 different colours in a given year in terms of the central angles (in degrees) with respect to the total number of buses manufactured during that year of all the 7 colours taken together.
What is the difference in the percentage shares of buses of C4 and C6? [Give your answer correct to 2 decimal places.]
- 111.11%false
- 28.33 %true
- 39.09 %false
- 412.5 %false
- Show Answer
- Workspace
- Discuss