Maths Practice Question and Answer
8 Q: Running at the speed of 3 km/hr., a person reaches his destination 10 minutes later than usual time. if he increases his speed by 1 km/hr., he reaches his destination 15 min earlier. and the distance to his destination.
965 064e5e3e0646d8ab6ebd7ad9f
64e5e3e0646d8ab6ebd7ad9f- 110 kmfalse
- 212 kmfalse
- 35 kmtrue
- 44 kmfalse
- 5None of thesefalse
- Show AnswerHide Answer
- Workspace
- SingleChoice
Answer : 3. "5 km "
Q: 4 years hence, the ratio of ages A and B will be 5: 7 and 6 years hence, the ratio of ages will be 11: 15, then and their present ages.
1008 064e5e2303be218b6cdc27e92
64e5e2303be218b6cdc27e92- 120 years, 26 yearsfalse
- 216 years, 24 yearstrue
- 318 years, 28 yearsfalse
- 412 years, 18 yearsfalse
- 5None of thesefalse
- Show AnswerHide Answer
- Workspace
- SingleChoice
Answer : 2. "16 years, 24 years"
Q: A and B together can do a piece of work in 12 days, A and C together can do the same work in 15 days. If B and C together can do the same work in 20 days, then in how many days A, B and C together can complete the same work?
869 064e5e17cd928d8b7160dffc1
64e5e17cd928d8b7160dffc1- 18false
- 26false
- 310true
- 49false
- 5None of thesefalse
- Show AnswerHide Answer
- Workspace
- SingleChoice
Answer : 3. "10"
Q:Direction: Study the following line graph carefully and answer the questions given below.
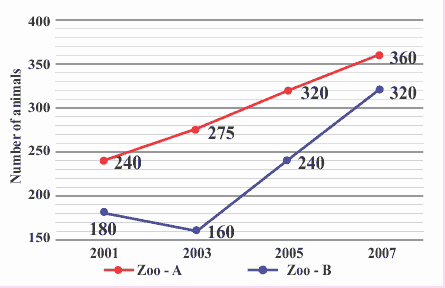
In the below line graph, the number of animals in two zoo A and B in the years – 2001, 2003, 2005 and 2007 is given.

If the number of animals in zoo-B in the years 2009 is 25% more than that in the year 2007, then what is the average number of animals in zoo-B in the years 2005, 2007 and 2009?
689 064e5dd093be218b6cdc27542
64e5dd093be218b6cdc27542In the below line graph, the number of animals in two zoo A and B in the years – 2001, 2003, 2005 and 2007 is given.

- 1260false
- 2320true
- 3260false
- 4240false
- 5None of thesefalse
- Show AnswerHide Answer
- Workspace
- SingleChoice
Answer : 2. "320"
Q:Direction: Study the following line graph carefully and answer the questions given below.
In the below line graph, the number of animals in two zoo A and B in the years – 2001, 2003, 2005 and 2007 is given.

Sum of the number of animals in zoo-B in the years 2001, 2003 and 2005 together is what per cent more/less than the sum of the number of animals in zoo-A in the years 2001 and 2007 together?
610 064e5dc21640c09b72f94d305
64e5dc21640c09b72f94d305In the below line graph, the number of animals in two zoo A and B in the years – 2001, 2003, 2005 and 2007 is given.

- 1$$6 {1\over 4}$$ %false
- 2$$5{1\over 3}$$ %false
- 3$$3 {1\over 3}$$ %true
- 4$$8 {1\over 3}$$ %false
- 5None of thesefalse
- Show AnswerHide Answer
- Workspace
- SingleChoice
Answer : 3. "$$3 {1\over 3}$$ %"
Q:Direction: Study the following line graph carefully and answer the questions given below.
In the below line graph, the number of animals in two zoo A and B in the years – 2001, 2003, 2005 and 2007 is given.

If in the year 2005, 35% of animals in zoo-A and 55% of animals in zoo-B are carnivorous, then what is the sum of the number of carnivorous animals in zoo A and B in the years 2005?
669 064e5db5fd928d8b7160df4b6
64e5db5fd928d8b7160df4b6In the below line graph, the number of animals in two zoo A and B in the years – 2001, 2003, 2005 and 2007 is given.

- 1184false
- 2196false
- 3222false
- 4244true
- 5None of thesefalse
- Show AnswerHide Answer
- Workspace
- SingleChoice
Answer : 4. "244"
Q:Direction: Study the following line graph carefully and answer the questions given below.
In the below line graph, the number of animals in two zoo A and B in the years – 2001, 2003, 2005 and 2007 is given.

What is the sum of the differences of the number of animals in zoo-A and zoo-B in the years 2001, 2003 and 2005?
718 064e5dac2d928d8b7160df487
64e5dac2d928d8b7160df487In the below line graph, the number of animals in two zoo A and B in the years – 2001, 2003, 2005 and 2007 is given.

- 1185false
- 2235false
- 3255true
- 4275false
- 5None of thesefalse
- Show AnswerHide Answer
- Workspace
- SingleChoice
Answer : 3. "255"
Q:Direction: Study the following line graph carefully and answer the questions given below.
In the below line graph, the number of animals in two zoo A and B in the years – 2001, 2003, 2005 and 2007 is given.

What is the ratio of the number of animals in zoo-A in the years 2001 and 2005 together and the number of animals in zoo-B in the years 2003 and 2007 together?
739 064e5d9e2640c09b72f94cfb5
64e5d9e2640c09b72f94cfb5In the below line graph, the number of animals in two zoo A and B in the years – 2001, 2003, 2005 and 2007 is given.

- 17: 6true
- 26: 7false
- 35: 6false
- 47: 5false
- 5None of thesefalse
- Show AnswerHide Answer
- Workspace
- SingleChoice

