Pie chart formula and examples with explanation for SSC and Bank Exams

Here are the pie chart formula and examples with explanation for those students who appeared in competitive exams. Most of the students are puzzled to using pie chart formulas in SSC and bank exams.
So, let's try to solve the pie chart questions using these formulas and learn how to use formulas with different equational examples. Practice with these pie chart formulas and pie chart questions with answers to build up your confidence.
Pie Chart Formula Examples with Explanation for Competitive Exams
What is pie chart?
A chart is a circular chart divided into sectors in which the are length, its central angle and area are proportional to the quantities that it represents.
The pie-chart is a method of representing a given numerical data in the form the sectors of a circle.
The sectors of the circle are constructed in such a way that the area of each sector is proportional to the corresponding value of the component of the data.
From geometry, we know that the area of the sector of a circle is proportional to the central angle.
So, the central angle of each sector must be proportional to the corresponding value of the component.
Since the sum of all the central angles is 3600, we have
Central angle of the component
$$ =\left({Value\ of \ the \ component\over Total \ value} ×360 \right)^0$$
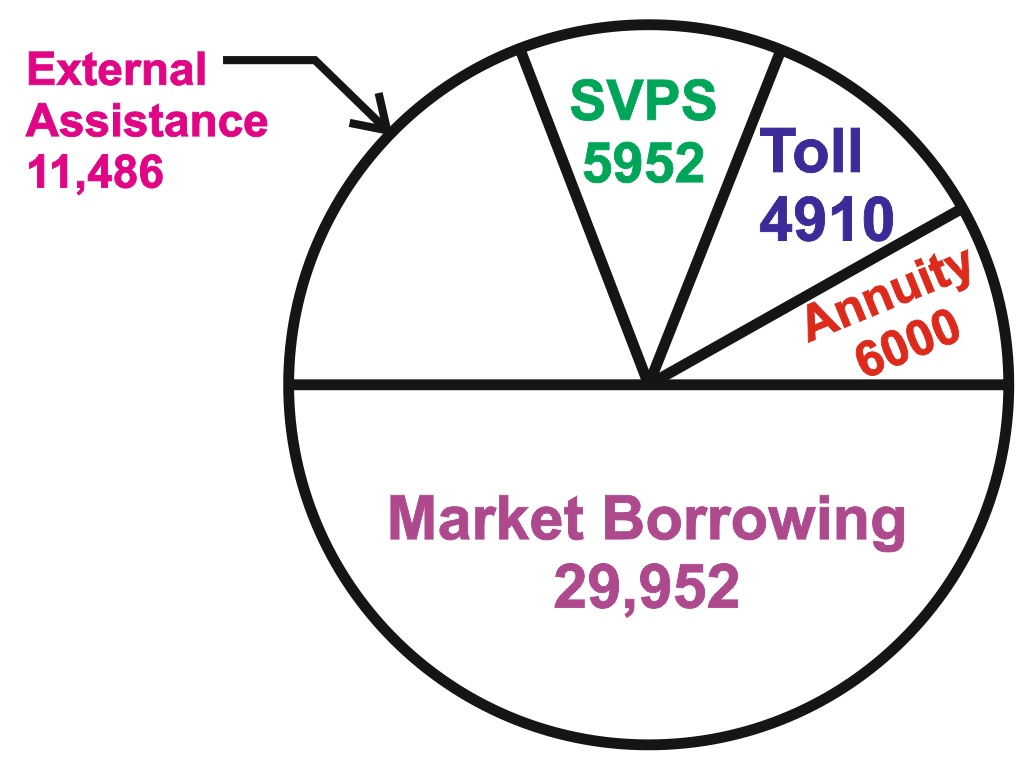
Example .1. The following pie-chart shows the sources of funds to be collected by the National Highways Authority of India (NHAI) for its Phase II projects. Study the pie-chart and answer the question that follow.
SOURCE OF FUNDS TO BE ARRANGED BY NHAI
FOR PHASE II PROJECTS (IN CRORES RS.)
 Total funds to be arranged for Projects (Phase II) = Rs. 57,600 crores.
Q.1. Near about 20% of the funds are to be arranged through:
(A) SPVS (B) External (C) Annuity (D) Market Borrowing
Explanation
20% of the total funds to be arranged = Rs. ( 20% of 57600) crores
= Rs. 11520 crores ≈ Rs. 11486 crores.
Q.2. The central angle corresponding to Market Borrowing is:
(A) 520 (B) 137.8% (C) 187.20 (D) 192.40
Explanation
Central angle corresponding to Marketing Borrowing $$ =\left({29952\over 57600} ×360^0 \right)= 187.2^0$$
Q.3. The approximate ratio of the funds to be arranged through Toll and that through Market Borrowing is:
(A) 2:9 (B) 1:6 (C) 3:11 (D) 2:5
Explanation
$$Required \ ratio = {4910\over 29952}={1\over6.1}≈{1\over6}$$
Q.4. If NHAI could receive a total of Rs. 9695 crores as External Assistance, by what percent (approximately) should it increase the market Borrowings to arrange for the shortage of funds?
(A) 4.5% (B) 7.5% (C) 6% (D) 8%
Explanation
Shortage of funds arranged through External Assistance
= Rs. (11486 – 9695) crores = Rs. 1791 crores.
∴ Increase required in Market Borrowing = Rs. 1791 crores.
Percentage increase required = $$ =\left({1791\over 29952} ×100 \right)\% = 5.98\%≈6% $$
Q.5. If the toll to be collected through an outsourced agency by allowing a maximum 10% commission, how much amount should be permitted to be collected by the outsourced agency, so that the project is supported with Rs. 4910 crores?
(A) Rs. 6213 crores (B) Rs. 5827 crores (C) Rs. 5401 crores (D) RS. 5216 cores
Explanation
Amount permitted = (Fund required from Toll for projects of Phase II)+(10% of these funds)
= Rs. 4910 crores + Rs. (10% of 4910) crores.
= Rs. (4910+491) crores = Rs. 5401 crores.
Keep practice these pie chart formula and examples with explanation which will make you comfortable while taking the exam. Ask me anything in the comment section related pie chart formula.


