Join Examsbook
Find the average number of pencils sold by P, Q and T?
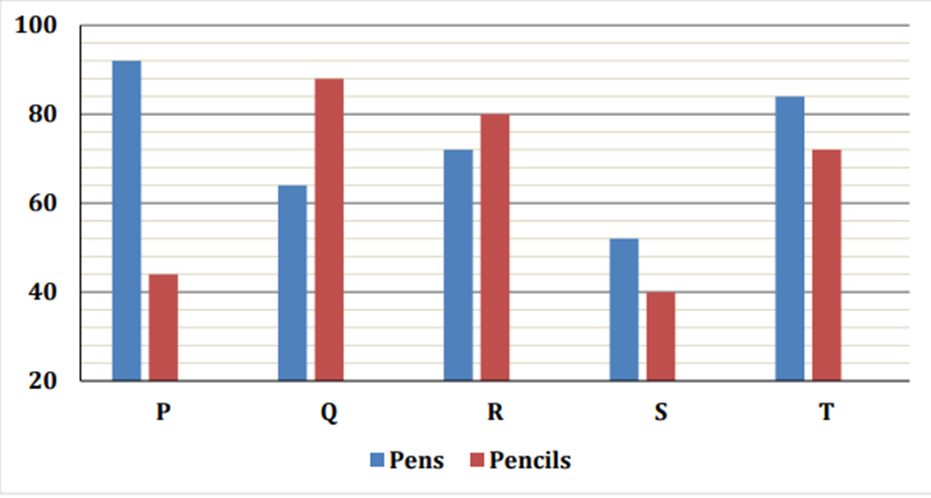
5Direction: Bar graph given below shows number of pens and pencils sold by five different shops. Read the data carefully and answer the questions.
Q:
Find the average number of pencils sold by P, Q and T?
- 164false
- 278false
- 364false
- 468true
- 572false
- Show AnswerHide Answer
- Workspace