Join Examsbook
The following bar graph shows the number of students who like four different colours.

Q:
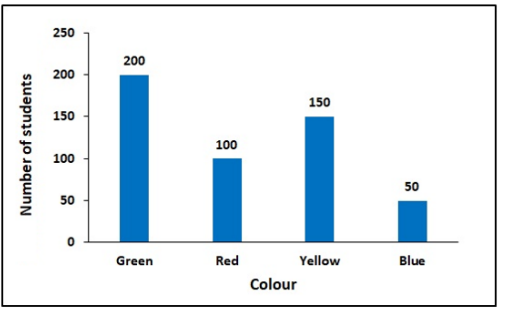
The following bar graph shows the number of students who like four different colours.

- 1100true
- 2125false
- 350false
- 460false
- Show Answer
- Workspace

