Join Examsbook
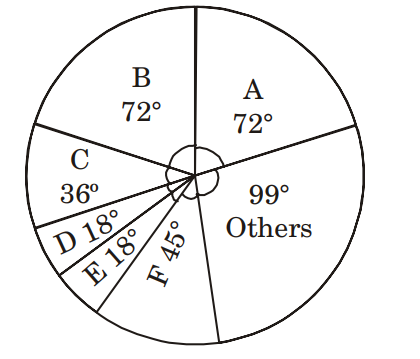
If a total of 1.5 million quintals of crop F was exported, then the total quantity of D and E that was exported (in million quintals) was
5Directions: The following Pie Chart shows the export of different food grains from India in 2010. Study the chart and answer the questions:

Q:
If a total of 1.5 million quintals of crop F was exported, then the total quantity of D and E that was exported (in million quintals) was
- 11.2true
- 21.5false
- 34.5false
- 46.5false
- Show Answer
- Workspace

