Join Examsbook
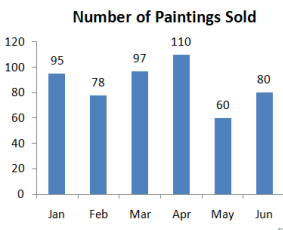
The bar graph shows the number of painting sold an art gallery in each month from January to June.
How many paintings does it need to sell in July for the 7 month average to be 90?
5Q:
The bar graph shows the number of painting sold an art gallery in each month from January to June.
How many paintings does it need to sell in July for the 7 month average to be 90?
- 1115false
- 285false
- 390false
- 4110true
- Show AnswerHide Answer
- Workspace

