Join Examsbook
The ratio of the demand and production of colour televisions of company E is :
5Directions : The bar graph, given here, shows the demand and production of colour televisions of five companies for Diwali season in the year 2009. Study the graph carefully and answer the questions based on the graph.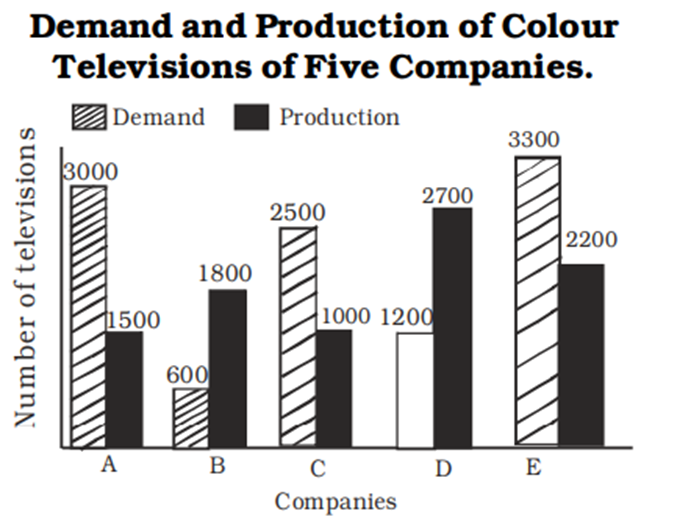
Q:
The ratio of the demand and production of colour televisions of company E is :
- 13 : 2true
- 22 : 3false
- 32 : 1false
- 41 : 2false
- Show AnswerHide Answer
- Workspace