Join Examsbook
The total number of Men working in all six years is how much more/less than total number of Women working in all six years together?
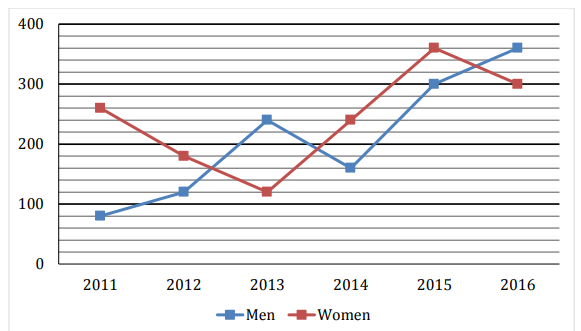
5Direction: The line chart given below shows number of labourers (men and women) working in six different years. Study the data carefully and answer the following questions.
Q:
The total number of Men working in all six years is how much more/less than total number of Women working in all six years together?
- 1140false
- 2160false
- 3180false
- 4200true
- 5None of the given optionsfalse
- Show Answer
- Workspace