Join Examsbook
The total quantity of wheat, rice, pulses and salts sold by company P is approximately what percentage more or less than the total quantities sold by company Q?
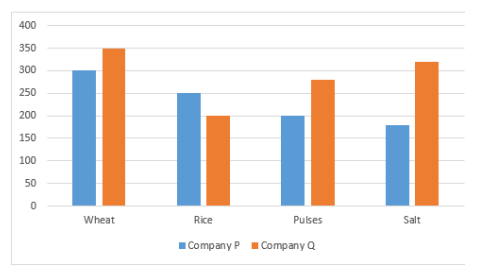
5Direction: Read the following graph carefully and answer the following questions:
The following bar graph shows the quantity(in kg) of wheat, rice, pulses and salts sold by two companies P and Q in the month of January.
Q:
The total quantity of wheat, rice, pulses and salts sold by company P is approximately what percentage more or less than the total quantities sold by company Q?
- 122% morefalse
- 225% lessfalse
- 315% morefalse
- 412% lessfalse
- 519% moretrue
- Show Answer
- Workspace