Aptitude Practice Question and Answer
8 Q: A and B together can do a certain work in x days. Working alone, A and B can do the same work in (x+8) and (x+18) days, respectively. A and B together will complete
1037 05fbe7257aa47db563875bf38
5fbe7257aa47db563875bf38- 112 daysfalse
- 28 daysfalse
- 310 daystrue
- 49 daysfalse
- Show Answer
- Workspace
- SingleChoice
Answer : 3. "10 days"
Q: The average of ten numbers is 72. The average of the first four numbers is 69 and that of the next three number is 74. The 8th number is 6 more than the 9th number and 12 more than the 10th number. What is the average of the 8th and 9th numbers?
1051 05fbe71b5aa47db563875bb72
5fbe71b5aa47db563875bb72- 176false
- 276.5false
- 377true
- 477.5false
- Show Answer
- Workspace
- SingleChoice
Answer : 3. "77"
Q: A kite is flying at a height of 123 meter. The thread attached to it assumed to be stretched straight and makes an angle of 60° with the level ground. The length of the string will be
992 05fbe71142e911753dd562895
5fbe71142e911753dd562895- 1142 mtrue
- 2140 mfalse
- 3139 mfalse
- 4138 mfalse
- Show Answer
- Workspace
- SingleChoice
Answer : 1. "142 m"
Q: A circular park whose diameter is 210 m has a 5 m wide path running around it(on the outside). What is the area ( in m2) of the path?
890 05fbe70c9aa47db563875b7ae
5fbe70c9aa47db563875b7ae- 11020 πfalse
- 21075 πtrue
- 31050 πfalse
- 41100 πfalse
- Show Answer
- Workspace
- SingleChoice
Answer : 2. "1075 π"
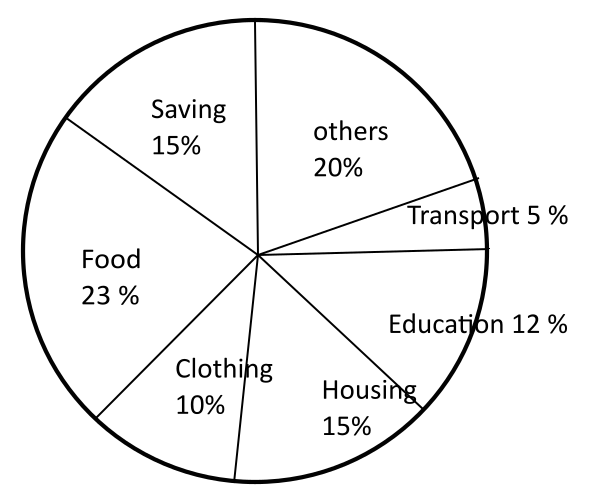
Q:Pie chart shows the percent of money spent by family on various item during 1999. Study the graph and answer these questions.

Graph shows that the maximum amount was spent on
1039 05fb4e5bfbf36696eb82682fb
5fb4e5bfbf36696eb82682fb
- 1Foodtrue
- 2Clothingfalse
- 3Housingfalse
- 4Othersfalse
- Show Answer
- Workspace
- SingleChoice
Answer : 1. "Food"
Q:Pie chart shows the percent of money spent by family on various item during 1999. Study the graph and answer these questions.

The ratio of the total amount of money spent on housing to that spent on education was
1094 05fb4e543bf36696eb8268137
5fb4e543bf36696eb8268137
- 15:2false
- 22:5false
- 34:5false
- 45:4true
- Show Answer
- Workspace
- SingleChoice
Answer : 4. " 5:4"
Q:Pie chart shows the percent of money spent by family on various item during 1999. Study the graph and answer these questions.

If the total amount spent was Rs. 46,000, how much money was spent on clothing and housing together?
943 05fb4e4ff488efb77b438030b
5fb4e4ff488efb77b438030b
- 1Rs. 1150false
- 2Rs. 11500true
- 3Rs. 10000false
- 4Rs. 15000false
- Show Answer
- Workspace
- SingleChoice
Answer : 2. "Rs. 11500"
Q:Pie chart shows the percent of money spent by family on various item during 1999. Study the graph and answer these questions.

If the total amount spent during the year 1999 was Rs. 46000, the amount spent on food was :
2168 05fb4e3e9488efb77b437fdc8
5fb4e3e9488efb77b437fdc8
- 1Rs. 2000false
- 2Rs. 2300false
- 3Rs. 11500false
- 4Rs. 10580true
- Show Answer
- Workspace
- SingleChoice

