Aptitude Practice Question and Answer
8 Q:Direction: Study the double bar graph given below and answer the questions.
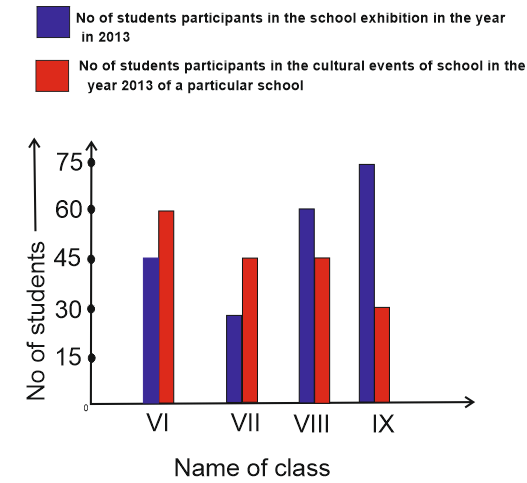
The average of the number of students participating in exhibition is:
3513 05d932291bc45ad7944d99fa0
5d932291bc45ad7944d99fa0- 148.75false
- 252.5true
- 345false
- 450false
- Show AnswerHide Answer
- Workspace
- SingleChoice
Answer : 2. "52.5"
Q:Direction: Study the double bar graph given below and answer the questions.
The average of the number of students participating in cultural events is:
2777 05d9321e7c263b979273f36b1
5d9321e7c263b979273f36b1- 148.75false
- 252.5false
- 345true
- 450false
- Show AnswerHide Answer
- Workspace
- SingleChoice
Answer : 3. "45"
Q: If $$ sin θ ={20 \over 29}$$, then what is the value of sec θ sin θ?
2943 25d931eb2c263b979273f369a
5d931eb2c263b979273f369a- 1$$ {20 \over 21}$$true
- 2$$ {29 \over 20}$$false
- 3$$ {21 \over 20}$$false
- 4$$ {21 \over 29}$$false
- Show AnswerHide Answer
- Workspace
- SingleChoice
Answer : 1. "$$ {20 \over 21}$$"
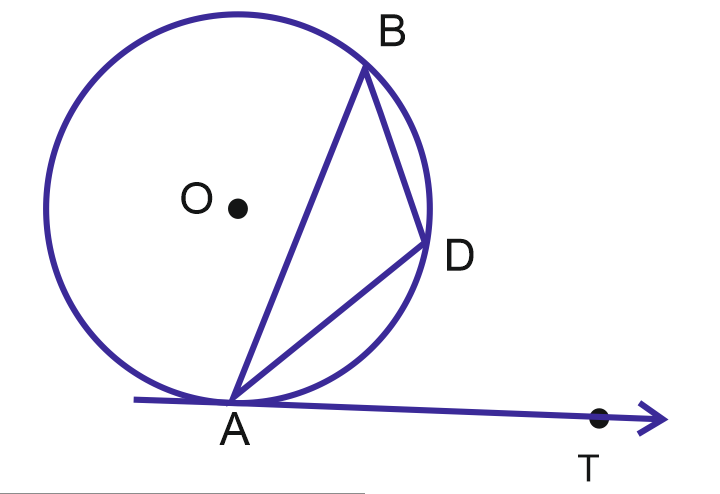
Q: In the figure below, AB is a chord of a circle with centre O. A tangent AT is drawn at point A so that ∠BAT=50°.Then ∠ADB=?
2789 05d931c619fdacf79284443c5
5d931c619fdacf79284443c5- 1120°false
- 2130°true
- 3140°false
- 4150°false
- Show AnswerHide Answer
- Workspace
- SingleChoice
Answer : 2. "130°"
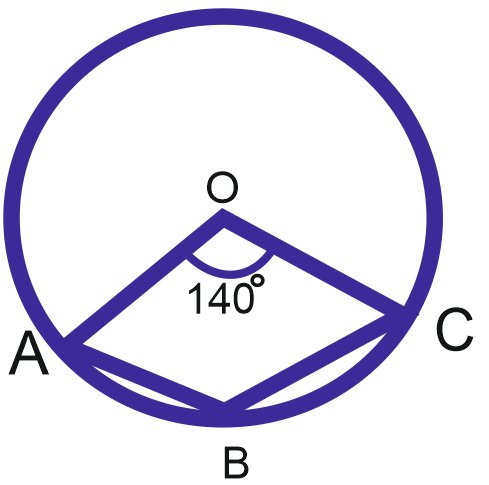
Q: In the adjoining figure ∠AOC=140° where O is the centre of the circle then ∠ ABC is equal to:
2836 15d931affc263b979273f3141
5d931affc263b979273f3141- 190°false
- 2110°true
- 3100°false
- 440°false
- Show AnswerHide Answer
- Workspace
- SingleChoice
Answer : 2. "110°"
Q: A tower standing on a horizontal plane subtends a certain angle at a point 160 m apart from the foot of the tower. On advancing 100 m towards it, the tower is found to subtend and angle twice as before. The height of the tower is
3130 15d931a116819c079458b7c82
5d931a116819c079458b7c82- 180 mtrue
- 2100 mfalse
- 3160 mfalse
- 4200 mfalse
- Show AnswerHide Answer
- Workspace
- SingleChoice
Answer : 1. "80 m"
Q:The distribution of fruit consumption in a sample of 72 seventeen – year – old girls is given in the graph below. Study the graph and answer the questions.
Distribution of Fruit Consumption
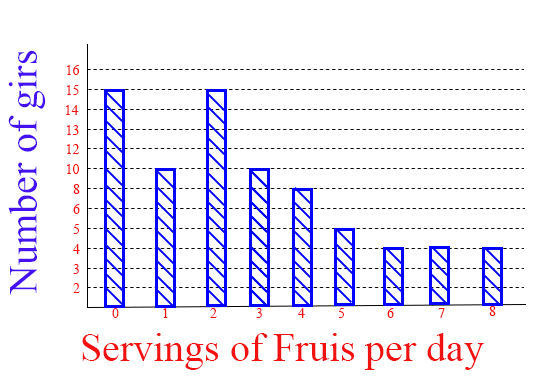
How many of these girls ate more than tow serving but less than six serving per day?
1336 05d92d8ed9fdacf79284440f0
5d92d8ed9fdacf79284440f0- 126false
- 218false
- 323true
- 438false
- Show AnswerHide Answer
- Workspace
- SingleChoice
Answer : 3. "23"
Q:The distribution of fruit consumption in a sample of 72 seventeen – year – old girls is given in the graph below. Study the graph and answer the questions.
Distribution of Fruit Consumption
How many of these girls ate fewer than two servings per day?
1612 05d92ca6dbc45ad7944d994e9
5d92ca6dbc45ad7944d994e9- 115false
- 240false
- 325true
- 4None of thesefalse
- Show AnswerHide Answer
- Workspace
- SingleChoice