POPULAR
 Data Interpretation Questions and Answers for Bank PO and SSC
  3074 views
Welcome to our Data Interpretation Question and Answer blog, your go-to resource for unravelling the mysteries of data analysis! In this space, we delve into the realm of interpreting data, offering insights, strategies, and solutions to tackle a variety of data interpretation challenges.
Data Interpretation is an essential part of the Mathematics subject of Quantitative Aptitude. Basically, data interpretation is based on the bar graph, line graph, tabulation,s and pie chart questions. Here are sharing some important questions related to this article.
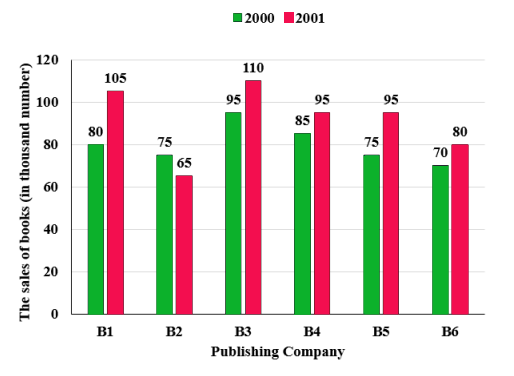
Data interpretation is an essential part of quantitative aptitude. Basically, data interpretation is a combination topic of the bar graph, line graph, tabulation and pie chart questions. But here I am sharing you, data interpretation questions with solutions related to bar graph and tabulation.
Data interpretation is an essential part of quantitative aptitude. In this data interpretation blog given all the topics like bar graph, line graph, pie chart, table chart.
The following histogram shows the height of players of a basketball team of a school.
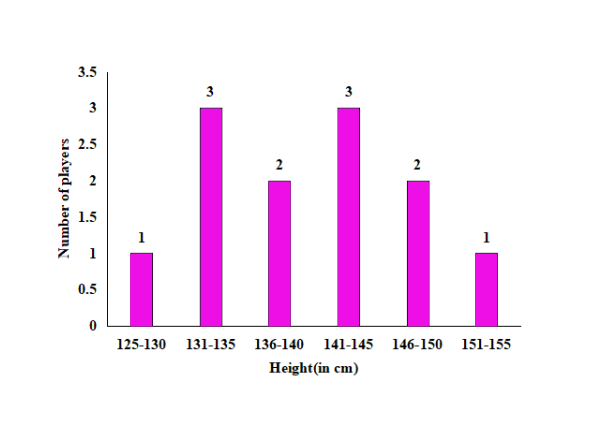
How many players have height less than 141 cm?
671 0 6450d85b39143d085f373d2eThe bar graph shows the number of passports issued in a country in 6 consecutive years.
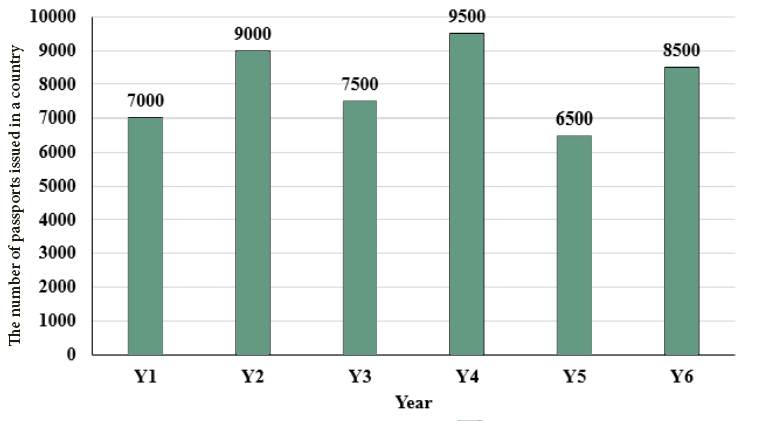
What is the average number of passports issued per year?
733 0 6450cd6139143d085f370f7dThe table given below shows the cost price and selling price of four articles.
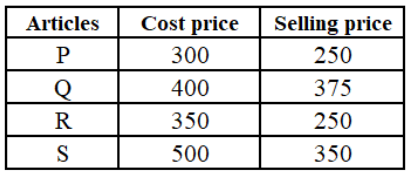
What is the average value of loss of all articles?
761 0 6450b2a7f3618908bf57165d