Data Interpretation Questions Practice Question and Answer
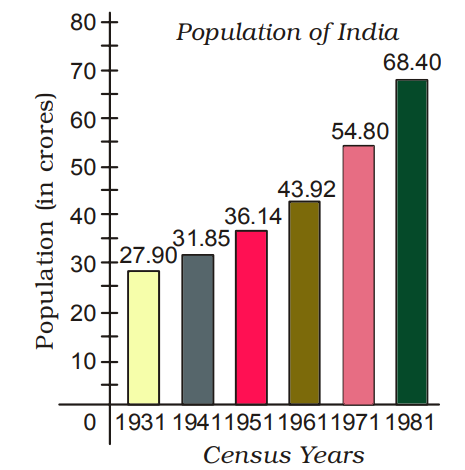
8 Q:Directions : The Bar Graph given here shows the population (in crores) of India in various census years. Observe the graph and answer the question based on it.

Peryear increase in population from the year 1931 to 1981 is
621 06453aa5613eb5908ae357970
6453aa5613eb5908ae357970
- 18100000true
- 27600000false
- 38900000false
- 46700000false
- Show AnswerHide Answer
- Workspace
- SingleChoice
Answer : 1. "8100000 "
Q:Directions : The Bar Graph given here shows the population (in crores) of India in various census years. Observe the graph and answer the question based on it.

In which census year, the per cent increase in population is least as compared to that in the previous census year?
469 06453a9d1f3618908bf5e24c1
6453a9d1f3618908bf5e24c1
- 11961false
- 21951true
- 31971false
- 41941false
- Show AnswerHide Answer
- Workspace
- SingleChoice
Answer : 2. "1951 "
Q:Directions : The Bar Graph given here shows the population (in crores) of India in various census years. Observe the graph and answer the question based on it.

In which census year, the per cent increase in population is highest as compared to that in the previous census year?
361 06453a943613f9f6e3315cfe5
6453a943613f9f6e3315cfe5
- 11951false
- 21961false
- 31971false
- 41981true
- Show AnswerHide Answer
- Workspace
- SingleChoice
Answer : 4. "1981 "
Q:Directions : The Bar Graph given here shows the population (in crores) of India in various census years. Observe the graph and answer the question based on it.

The per cent increase in population from 1971 to 1981 is
401 06453a8987f825208661904d8
6453a8987f825208661904d8
- 124.8%true
- 220%false
- 316.7%false
- 422.9%false
- Show AnswerHide Answer
- Workspace
- SingleChoice
Answer : 1. "24.8% "
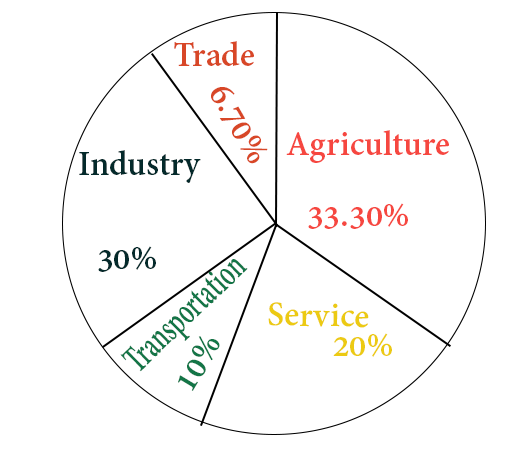
Q:Directions : Study the following pie chart carefully and answer the questions. The pie chart represents the percentage of people involved in various occupations.
Total number of people = 20000

The difference between the maximum number of people involved and minimum number of people involved in various professions is
382 06453a55339143d085f3e5a73
6453a55339143d085f3e5a73Total number of people = 20000

- 12640false
- 23640false
- 36320false
- 45320true
- Show AnswerHide Answer
- Workspace
- SingleChoice
Answer : 4. "5320"
Q:Directions : Study the following pie chart carefully and answer the questions. The pie chart represents the percentage of people involved in various occupations.
Total number of people = 20000

The sectoral angle made by the people involved in service in the given pie-chart is
358 06453a4ef56b58a42369ad85f
6453a4ef56b58a42369ad85fTotal number of people = 20000

- 136°false
- 290°false
- 372°true
- 4108°false
- Show AnswerHide Answer
- Workspace
- SingleChoice
Answer : 3. "72°"
Q:Directions : Study the following pie chart carefully and answer the questions. The pie chart represents the percentage of people involved in various occupations.
Total number of people = 20000

The ratio of the people involved in service to that in industry is
403 06453a49cf3618908bf5e16b4
6453a49cf3618908bf5e16b4Total number of people = 20000

- 11 : 2false
- 22 : 3true
- 33 : 4false
- 43 : 2false
- Show AnswerHide Answer
- Workspace
- SingleChoice
Answer : 2. "2 : 3 "
Q:Directions : Study the following pie chart carefully and answer the questions. The pie chart represents the percentage of people involved in various occupations.
Total number of people = 20000

How many more people are involved in service than in trade?
425 06453a41456b58a42369ad592
6453a41456b58a42369ad592Total number of people = 20000

- 13660false
- 22660true
- 31660false
- 4660false
- Show AnswerHide Answer
- Workspace
- SingleChoice

