Data Interpretation Questions Practice Question and Answer
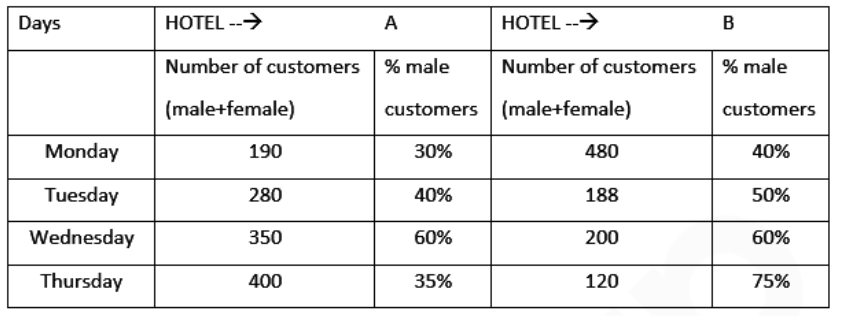
8 Q:Direction: Study the following information to answer the questions.

In hotel B, the ratio of female customers on Tuesday and Friday was 2 : 3. If on Friday, female customers constituted 50% of the number of customers (male + female), then what was the number of customers (male + female) in hotel B on Friday?
926 0609d1b598cf832661da7b4e1
609d1b598cf832661da7b4e1
- 1282true
- 2276false
- 3288false
- 4296false
- 5294false
- Show AnswerHide Answer
- Workspace
- SingleChoice
Answer : 1. "282"
Q:Direction: Study the following information to answer the questions.

The number of customers (male + female) in hotel A and B are increased by 50% and 15% respectively from Thursday to Saturday. If the total number of female customers in hotel A and B together was equal on Thursday and Saturday, what was the total number of male customers in hotel A and B together on Saturday?
987 0609d1aa3e941dd6183d638e3
609d1aa3e941dd6183d638e3
- 1448true
- 2452false
- 3458false
- 4438false
- 5442false
- Show AnswerHide Answer
- Workspace
- SingleChoice
Answer : 1. "448"
Q:Direction: Study the following information to answer the questions.

On Wednesday, in hotel A, 30% of male customers and 70% of female customers were from Town X. what was the number of customers in hotel A from town X on Wednesday?
1553 0609d19d8e941dd6183d6385e
609d19d8e941dd6183d6385e
- 1153false
- 2157false
- 3161true
- 4183false
- 5181false
- Show AnswerHide Answer
- Workspace
- SingleChoice
Answer : 3. "161 "
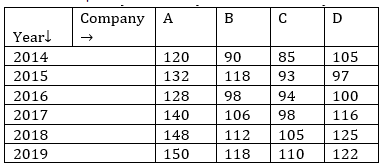
Q:The given table represents the number of engineers recruited by four companies A, B, C and D over the years. Study the table carefully and answer the question that follow.

The total number of engineers recruited by company A in 2014 to 2017 is what percentage more than the total number of engineers recruited by all four companies in 2019?
1035 060927140bef26c5d152b8bfe
60927140bef26c5d152b8bfe
- 13.5false
- 22.5false
- 33false
- 44true
- Show AnswerHide Answer
- Workspace
- SingleChoice
Answer : 4. "4"
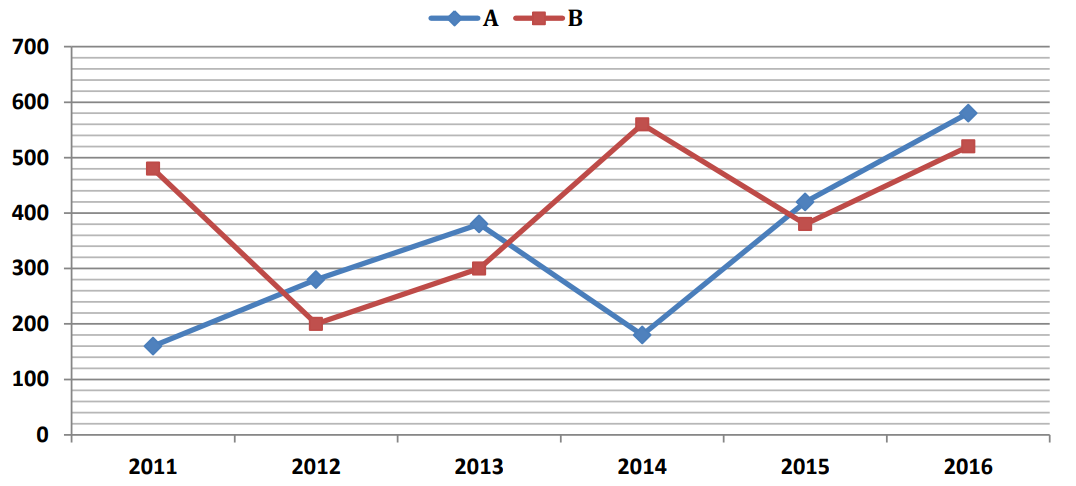
Q:Directions :- Refer the graph and answer the given questions.
The following line graph shows the number of products sold by company A and B during six years.

The number of products sold by A in 2014 is what per cent of the number of products sold by B in 2013?
1005 05fd32ec9c46a213fc5c470f1
5fd32ec9c46a213fc5c470f1The following line graph shows the number of products sold by company A and B during six years.

- 160%true
- 250%false
- 348%false
- 456%false
- 5None of thesefalse
- Show AnswerHide Answer
- Workspace
- SingleChoice
Answer : 1. "60%"
Q:Directions :- Refer the graph and answer the given questions.
The following line graph shows the number of products sold by company A and B during six years.

What is the difference between the total number of products sold by B in 2011, 2012 and 2016 together and the total number of products sold by A in 2011, 2012 and 2013 together?
1177 05fd32f73c46a213fc5c474b4
5fd32f73c46a213fc5c474b4The following line graph shows the number of products sold by company A and B during six years.

- 1480false
- 2360false
- 3580false
- 4380true
- 5280false
- Show AnswerHide Answer
- Workspace
- SingleChoice
Answer : 4. "380"
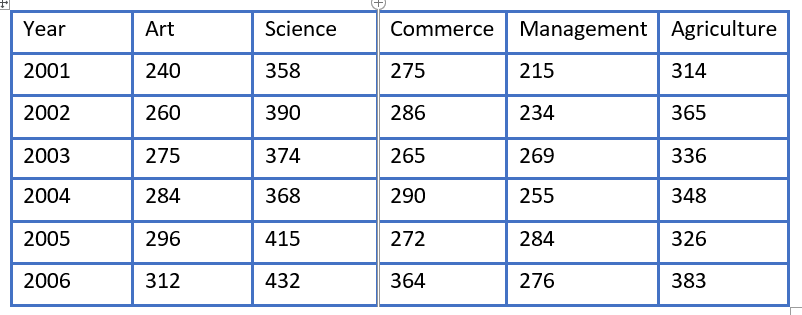
Q:Study the following table carefully and answer the questions given below.

The total number of students in Agriculture in 2001 and 2005 together was approximately what percent of number of students from the same discipline in 2002?
1471 05da04fbc77652578d4eff0a2
5da04fbc77652578d4eff0a2
- 175false
- 2165false
- 365false
- 4175true
- 5190false
- Show AnswerHide Answer
- Workspace
- SingleChoice
Answer : 4. "175"
Q:Directions: The following table represents the percentage marks of four students in six subjects.
Consider the table and answer questions based on it

Who has the highest total marks?
1193 060795a880e46170693fcbb88
60795a880e46170693fcbb88Consider the table and answer questions based on it

- 1Shamitafalse
- 2Smitafalse
- 3Shilpatrue
- 4Sheelafalse
- Show AnswerHide Answer
- Workspace
- SingleChoice

