Data Interpretation Questions Practice Question and Answer
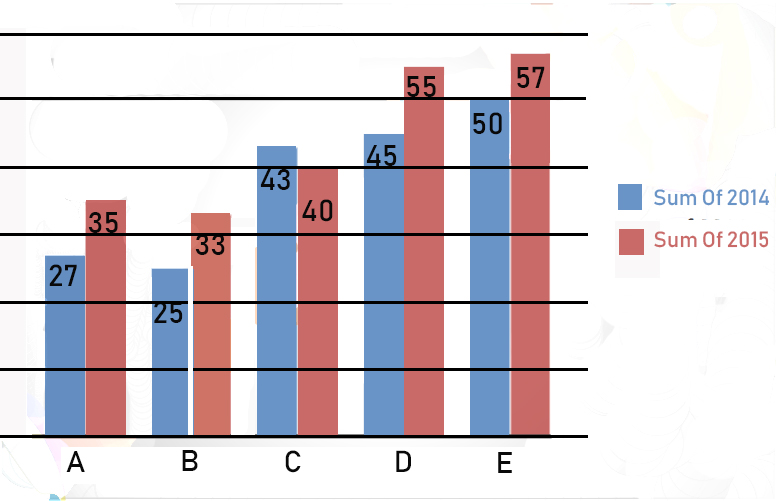
8 Q:Direction: The given Bar Graph Presents the number of different types of vehicles (in lakhs) exported by a company during 2014 and 2015.

The total number of type B, D and E vehicles exported in 2014 is what percentage of the total number of type A, C, D and E vehicles exported in 2015 (correct to one decimal place)?
774 060251238083f2c6596c27f10
60251238083f2c6596c27f10
- 163.8%false
- 264.2%true
- 362.4%false
- 461.6%false
- Show AnswerHide Answer
- Workspace
- SingleChoice
Answer : 2. "64.2% "
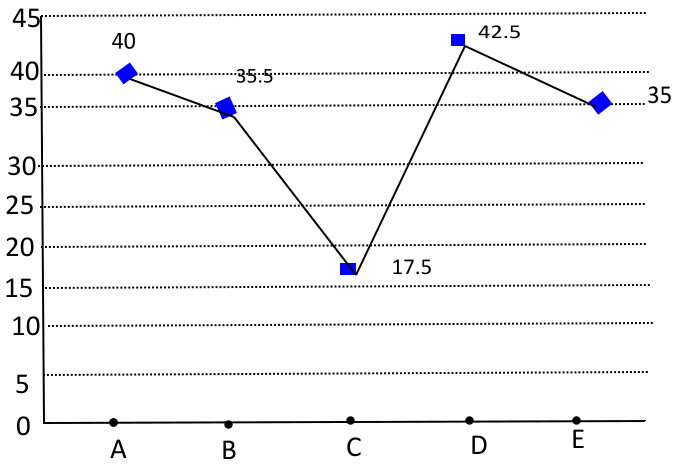
Q:Read the following graph carefully and answer the related questions-
Total number of students (in thousands) participating in comitative exam in various cities.

What is the ratio of number of students appearing for competitive exam from city C and D together to those appearing from A, D and E together?
660 060237ccbad295556282de8c5
60237ccbad295556282de8c5
- 111:13false
- 220:43false
- 324:47true
- 437:20false
- Show AnswerHide Answer
- Workspace
- SingleChoice
Answer : 3. "24:47 "
Q:Read the following graph carefully and answer the related questions-
Total number of students (in thousands) participating in comitative exam in various cities.

What is the percentage of students appearing in competitive exam from city E to total number of students appearing for competitive exam from all the states?
698 060237c5aad295556282de836
60237c5aad295556282de836
- 115false
- 217false
- 319false
- 421true
- Show AnswerHide Answer
- Workspace
- SingleChoice
Answer : 4. "21"
Q:Read the following graph carefully and answer the related questions-
Total number of students (in thousands) participating in comitative exam in various cities.

What is the average number of students appearing in competitive exam from all the states together?
1327 0602379a32dc71d4148a57f88
602379a32dc71d4148a57f88
- 133500false
- 23350false
- 317500false
- 4None of thesetrue
- Show AnswerHide Answer
- Workspace
- SingleChoice
Answer : 4. "None of these "
Q:Read the following graph carefully and answer the related questions-
Total number of students (in thousands) participating in comitative exam in various cities.

What is the ratio of number of students appearing tor competitive exam from city B to number of students appearing for competitive exam from city A?
787 0602377822dc71d4148a571bd
602377822dc71d4148a571bd
- 13:4false
- 213:16false
- 311:16false
- 4None of thesetrue
- Show AnswerHide Answer
- Workspace
- SingleChoice
Answer : 4. "None of these "
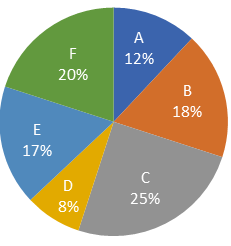
Q:Directions: Study the following pie chart carefully and answer the questions given beside.
The following pie chart gives the information about breakup of six different categories of workers in a company.

If total 1800 workers are working in the company then find the absolute difference between the number of workers in category D and category C?
765 0601a56da8f9c7c5b6d8f3b8b
601a56da8f9c7c5b6d8f3b8bThe following pie chart gives the information about breakup of six different categories of workers in a company.

- 1323false
- 2306true
- 3289false
- 4286false
- Show AnswerHide Answer
- Workspace
- SingleChoice
Answer : 2. "306"
Q:Directions: Study the following pie chart carefully and answer the questions given beside.
The following pie chart gives the information about breakup of six different categories of workers in a company.

One day, all the workers were present except 25 out of 102 of category E workers. Find the number of workers present on that day?
1103 0601a5563c12de45b38e20157
601a5563c12de45b38e20157The following pie chart gives the information about breakup of six different categories of workers in a company.

- 1600false
- 2625false
- 3550false
- 4575true
- Show AnswerHide Answer
- Workspace
- SingleChoice
Answer : 4. "575"
Q:Directions: Study the following pie chart carefully and answer the questions given beside.
The following pie chart gives the information about breakup of six different categories of workers in a company.

The number of Category B workers is what percentage more than that of category D workers?
904 0601a54e308ff1450d90c7983
601a54e308ff1450d90c7983The following pie chart gives the information about breakup of six different categories of workers in a company.

- 1140%false
- 2120%false
- 3100%false
- 4125%true
- Show AnswerHide Answer
- Workspace
- SingleChoice

