Data Interpretation Questions Practice Question and Answer
8 Q:Table below shows the number of candidates appearing for the interview and the percentage of candidates found eligible for the post in various companies (A, B, C, D, E, F).
Study the Tables and give answer the following Questions.
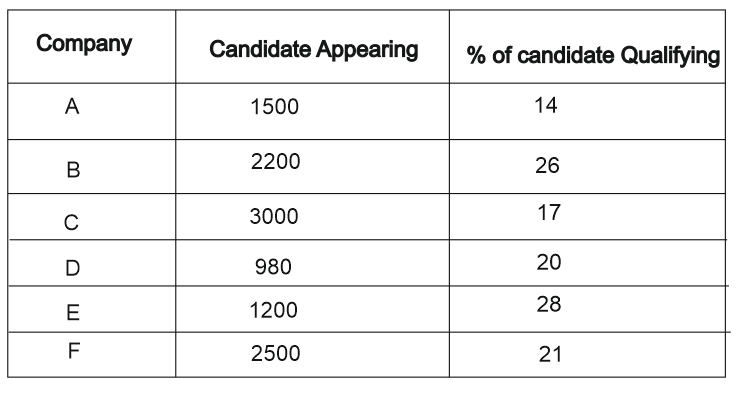
What is the respective ratio between the number of qualified candidates in Company A and the number of candidates qualified in Company E?
809 05f1e725ca844e17b150ccfc7
5f1e725ca844e17b150ccfc7Study the Tables and give answer the following Questions.

- 12:5false
- 23:7false
- 35:8true
- 45:6false
- Show AnswerHide Answer
- Workspace
- SingleChoice
Answer : 3. "5:8"
Q:Study the graph carefully and answer the following questions.
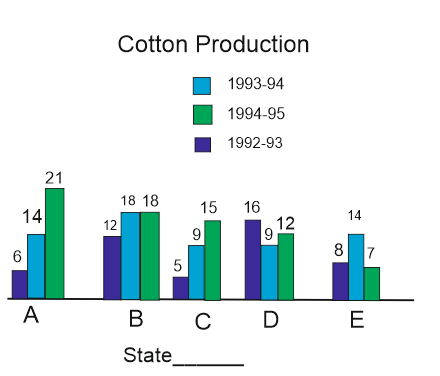
What is the average production of State C for three years?
824 05f15660bcf79540a75340cbf
5f15660bcf79540a75340cbf
- 19.33false
- 29.66true
- 38.33false
- 48.66false
- Show AnswerHide Answer
- Workspace
- SingleChoice
Answer : 2. "9.66"
Q:Study the graph carefully and answer the following questions.

What is the average production of the five states in the year 1994-95 taken together?
796 05f1565b7eddbc50839d53581
5f1565b7eddbc50839d53581
- 112.3false
- 214.6true
- 315.6false
- 416.3false
- Show AnswerHide Answer
- Workspace
- SingleChoice
Answer : 2. "14.6"
Q:Study the graph carefully and answer the following questions.

How many state showing above average production in 1992-93 showed below average production in 1993-94 ?
1172 05f15635deddbc50839d5259a
5f15635deddbc50839d5259a
- 14false
- 22true
- 33false
- 41false
- Show AnswerHide Answer
- Workspace
- SingleChoice
Answer : 2. "2"
Q:Study the graph carefully and answer the following questions.

The production of State D in 1993-94 is how many times its production in 1994-95 ?
1376 05f1562f0cf79540a75340301
5f1562f0cf79540a75340301
- 11.33false
- 20.75true
- 30.56false
- 41.77false
- Show AnswerHide Answer
- Workspace
- SingleChoice
Answer : 2. "0.75"
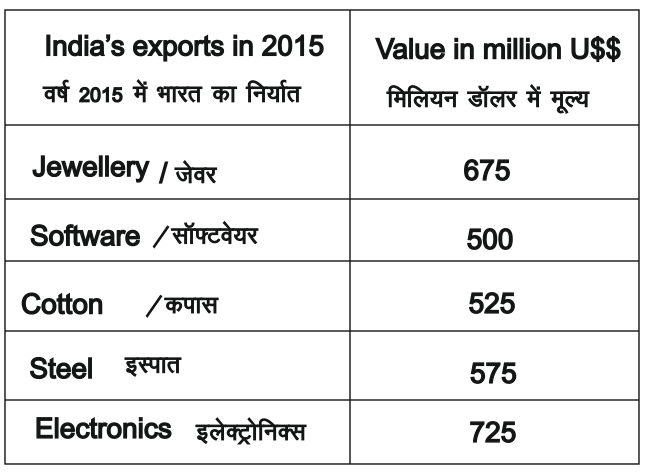
Q: Refer the below data table and answer the following question.
Jewellery was what percent of total exports?
1305 05f0e85011090a058653eba82
5f0e85011090a058653eba82Jewellery was what percent of total exports?

- 122.5 %true
- 225 %false
- 320 %false
- 427.5 %false
- Show AnswerHide Answer
- Workspace
- SingleChoice
Answer : 1. "22.5 %"
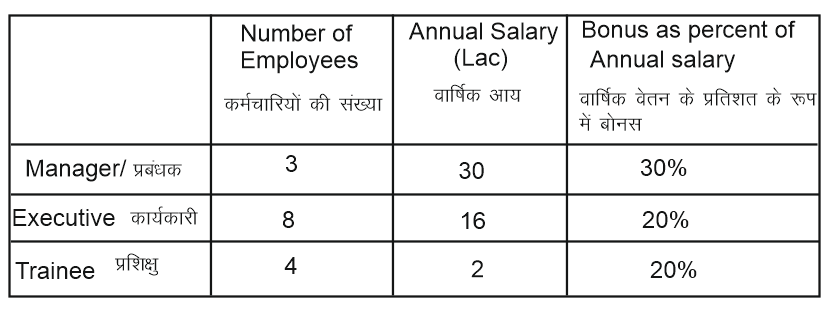
Q: Refer the below data table and answer the following questions.
What is the average bonus ( in rupees)?
1288 05f0e7eaa1090a058653e9553
5f0e7eaa1090a058653e9553What is the average bonus ( in rupees)?

- 1126000false
- 25419994false
- 3361333true
- 4None of thesefalse
- Show AnswerHide Answer
- Workspace
- SingleChoice
Answer : 3. "361333"
Q:A bar graph showing the height of six mountain peaks. Study the bar graph and answer the following Questions.
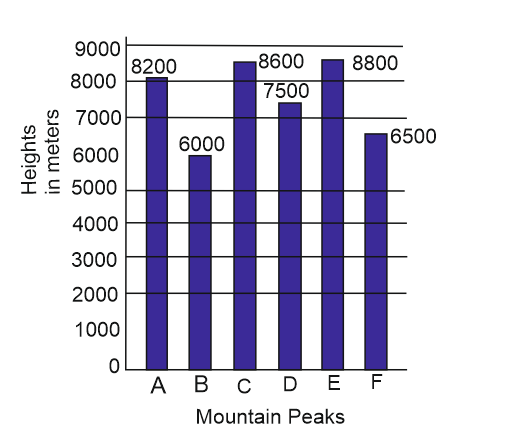
How much percentage is more than Peak A From Peak F?
895 05f06e025b13c2d244adab39a
5f06e025b13c2d244adab39a
- 1$$ {26}{4\over13}\%$$false
- 2$$ {26}{2\over13}\%$$true
- 3$$ {26}{8\over13}\%$$false
- 416 %false
- Show AnswerHide Answer
- Workspace
- SingleChoice

