Data Interpretation Questions Practice Question and Answer
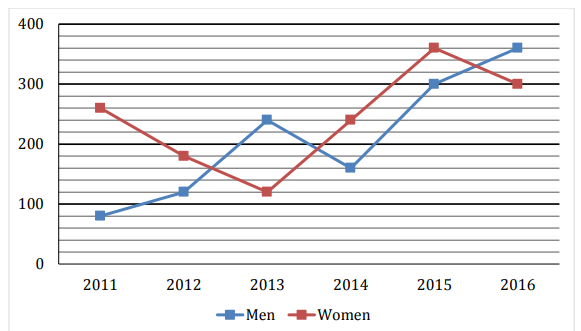
8 Q:Direction: The line chart given below shows number of labourers (men and women) working in six different years. Study the data carefully and answer the following questions.

The average number of Women working in 2014, 2015 and 2016 together is how much more/less than average number of Men working in 2011, 2014 and 2016 together?
296 064d4b2f2a798377447221ad1
64d4b2f2a798377447221ad1
- 1100true
- 280false
- 390false
- 470false
- 5None of the given optionsfalse
- Show AnswerHide Answer
- Workspace
- SingleChoice
Answer : 1. "100"
Q:Direction: The line chart given below shows number of labourers (men and women) working in six different years. Study the data carefully and answer the following questions.

The total number of Men working in 2012 and 2013 together is what per cent of the total number of labourers (Men + Women) working in 2014?
286 064d4ad07ebd5c3747277b3a4
64d4ad07ebd5c3747277b3a4
- 160%false
- 270%false
- 380%false
- 490%true
- 540%false
- Show AnswerHide Answer
- Workspace
- SingleChoice
Answer : 4. "90%"
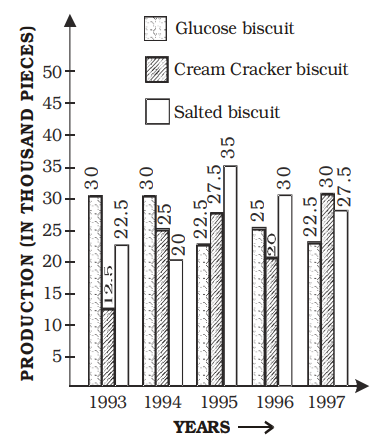
Q:Directions: The bar diagram given below shows the productions (in the unit of thousand pieces) of three types of biscuits by a company in the five consecutive years. Study the diagram and answer the following questions.

The ratio of production of glucose biscuits and total production of biscuits in that year was maximum in
407 06489af13b50f5316a45e39c2
6489af13b50f5316a45e39c2
- 11994false
- 21993false
- 31996false
- 41997true
- Show AnswerHide Answer
- Workspace
- SingleChoice
Answer : 4. "1997"
Q:Directions: The bar diagram given below shows the productions (in the unit of thousand pieces) of three types of biscuits by a company in the five consecutive years. Study the diagram and answer the following questions.

The production of all the three types of biscuits was maximum in the year
397 06489aea5f4063d472f4ae608
6489aea5f4063d472f4ae608
- 11995true
- 21994false
- 31996false
- 41993false
- Show AnswerHide Answer
- Workspace
- SingleChoice
Answer : 1. "1995 "
Q:Directions: The bar diagram given below shows the productions (in the unit of thousand pieces) of three types of biscuits by a company in the five consecutive years. Study the diagram and answer the following questions.

The difference (in the unit of thousand pieces) between the total number of cream cracker biscuits manufactured in the years 1993, 1995 and 1997 and the total number of the biscuits of same type in the years 1994 and 1996 is
373 064899f09b90df94e034c42f4
64899f09b90df94e034c42f4
- 115false
- 225true
- 330false
- 420false
- Show AnswerHide Answer
- Workspace
- SingleChoice
Answer : 2. "25 "
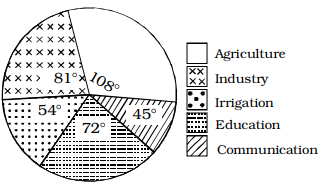
Q:Directions: The pie– chart shows the proposed outlay for different sectors during a Five–Year plan of Government of India. Total outlay is Rs. 40,000 crores. By reading the pie–chart answer the following three questions.

What is the ratio between the proposed outlay of Irrigation and Communication?
434 06489a579b50f5316a45e07b1
6489a579b50f5316a45e07b1
- 19 : 8false
- 23 : 2false
- 39 : 5false
- 46 : 5true
- Show AnswerHide Answer
- Workspace
- SingleChoice
Answer : 4. "6 : 5"
Q:Directions: The pie– chart shows the proposed outlay for different sectors during a Five–Year plan of Government of India. Total outlay is Rs. 40,000 crores. By reading the pie–chart answer the following three questions.

If the proposed outlay of Irrigation is x% of the proposed outlay of Agriculture, then x is equal to
378 06489a4b6f4063d472f4ac0dd
6489a4b6f4063d472f4ac0dd
- 150%true
- 215%false
- 325%false
- 475%false
- Show AnswerHide Answer
- Workspace
- SingleChoice
Answer : 1. "50% "
Q:Directions: The pie– chart shows the proposed outlay for different sectors during a Five–Year plan of Government of India. Total outlay is Rs. 40,000 crores. By reading the pie–chart answer the following three questions.

What is the proposed outlay for Education?
406 06489a3f7b90df94e034c7e06
6489a3f7b90df94e034c7e06
- 1Rs. 6000 croresfalse
- 2Rs. 8000 crorestrue
- 3Rs. 9000 croresfalse
- 4Rs. 7000 croresfalse
- Show AnswerHide Answer
- Workspace
- SingleChoice

