Statistics Questions Practice Question and Answer
4 Q: The mode and median of the data 8, 6, 8, 7, 8, 6, 8, 7, 6 is
2422 05e7c3a457af3db16e180d8c9
5e7c3a457af3db16e180d8c9- 17 and 8false
- 26 and 7false
- 38 and 7true
- 46 and 8false
- Show Answer
- Workspace
- SingleChoice
Answer : 3. "8 and 7"
Q:The distribution of fruit consumption in a sample of 72 seventeen – year – old girls is given in the graph below. Study the graph and answer the questions.
Distribution of Fruit Consumption
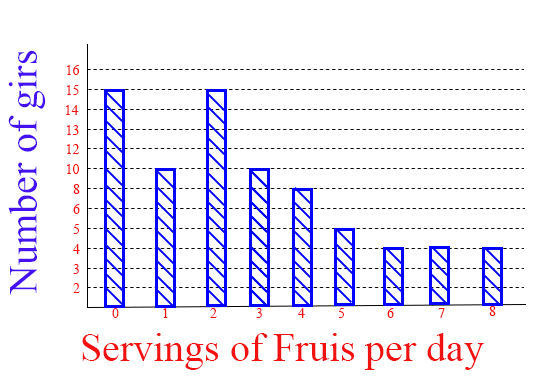
How many of these girls ate more than tow serving but less than six serving per day?
1164 05d92d8ed9fdacf79284440f0
5d92d8ed9fdacf79284440f0- 126false
- 218false
- 323true
- 438false
- Show Answer
- Workspace
- SingleChoice
Answer : 3. "23"
Q:The distribution of fruit consumption in a sample of 72 seventeen – year – old girls is given in the graph below. Study the graph and answer the questions.
Distribution of Fruit Consumption
How many of these girls ate fewer than two servings per day?
1402 05d92ca6dbc45ad7944d994e9
5d92ca6dbc45ad7944d994e9- 115false
- 240false
- 325true
- 4None of thesefalse
- Show Answer
- Workspace
- SingleChoice
Answer : 3. "25"
Q:The distribution of fruit consumption in a sample of 72 seventeen – year – old girls is given in the graph below. Study the graph and answer the questions.
Distribution of Fruit Consumption
What percent of these girls ate six or more servings per day
1170 05d92caf86819c079458b781c
5d92caf86819c079458b781c- 112.5%true
- 213%false
- 310%false
- 411%false
- Show Answer
- Workspace
- SingleChoice
Answer : 1. "12.5%"
- Prev
- 1
- Next