Maths Practice Question and Answer
8 Q:Directions: Find the wrong number in the following number series:
141, 156, 147, 162, 153, 165, 159
644 064d4b97ce0ce5574968ae499
64d4b97ce0ce5574968ae499- 1156false
- 2153false
- 3147false
- 4165true
- 5159false
- Show Answer
- Workspace
- SingleChoice
Answer : 4. "165"
Q:Directions: Find the wrong number in the following number series:
251, 252, 254, 227, 243, 118, 154
518 064d4b91e9ce88dacc3437ebc
64d4b91e9ce88dacc3437ebc- 1251false
- 2252true
- 3227false
- 4243false
- 5154false
- Show Answer
- Workspace
- SingleChoice
Answer : 2. "252"
Q:Directions: Find the wrong number in the following number series:
2, 3, 8, 31, 154, 924, 6460
590 064d4b805ebd5c3747277ead0
64d4b805ebd5c3747277ead0- 1924true
- 26460false
- 3154false
- 48false
- 531false
- Show Answer
- Workspace
- SingleChoice
Answer : 1. "924"
Q:Directions: Find the wrong number in the following number series:
4, 5.1, 7.3, 10.6, 15, 20, 27.1
527 064d4b7a890a003851de3e659
64d4b7a890a003851de3e659- 15.1false
- 24false
- 37.3false
- 420true
- 527.1false
- Show Answer
- Workspace
- SingleChoice
Answer : 4. "20"
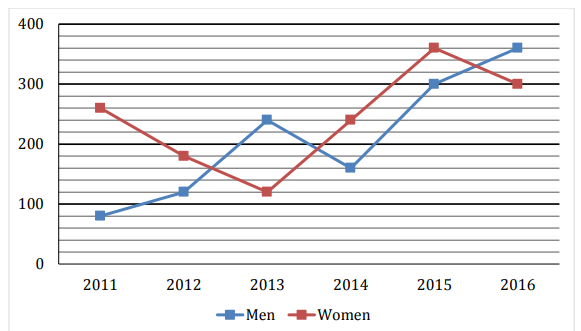
Q:Direction: The line chart given below shows number of labourers (men and women) working in six different years. Study the data carefully and answer the following questions.

The total number of Men working in all six years is how much more/less than total number of Women working in all six years together?
415 064d4b5b8d02c5c746bdc504a
64d4b5b8d02c5c746bdc504a
- 1140false
- 2160false
- 3180false
- 4200true
- 5None of the given optionsfalse
- Show Answer
- Workspace
- SingleChoice
Answer : 4. "200"
Q:Direction: The line chart given below shows number of labourers (men and women) working in six different years. Study the data carefully and answer the following questions.

Find the ratio between total number of Labors working in 2012 and 2013 together to total number of labors working in 2015 and 2016 together.
370 064d4b4859ce88dacc34350c3
64d4b4859ce88dacc34350c3
- 12: 1false
- 21: 2true
- 335: 66false
- 411: 10false
- 5None of the given optionsfalse
- Show Answer
- Workspace
- SingleChoice
Answer : 2. "1: 2"
Q:Direction: The line chart given below shows number of labourers (men and women) working in six different years. Study the data carefully and answer the following questions.

The number of Men working in 2017 is 15% more than that of 2015 while the number of Women working in 2017 is 40% less than that of 2014. Find the total number of labourers (Men + Women) working in 2017.
390 064d4b3979ce88dacc34344f7
64d4b3979ce88dacc34344f7
- 1561false
- 2456false
- 3489true
- 4594false
- 5630false
- Show Answer
- Workspace
- SingleChoice
Answer : 3. "489"
Q:Direction: The line chart given below shows number of labourers (men and women) working in six different years. Study the data carefully and answer the following questions.

The average number of Women working in 2014, 2015 and 2016 together is how much more/less than average number of Men working in 2011, 2014 and 2016 together?
385 064d4b2f2a798377447221ad1
64d4b2f2a798377447221ad1
- 1100true
- 280false
- 390false
- 470false
- 5None of the given optionsfalse
- Show Answer
- Workspace
- SingleChoice

