Data Interpretation Question and Answer for Competitive Exams

The bar graph shows the number of painting sold an art gallery in each month from January to June.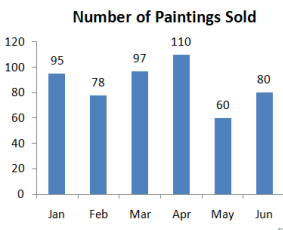
How many paintings does it need to sell in July for the 7 month average to be 90?
(A) 115
(B) 85
(C) 90
(D) 110
Correct Answer : D
If the following poverty line population of the village ‘X’ is 12160, then the population of village ‘S’ is

(A) 18500
(B) 20500
(C) 22000
(D) 20000
Correct Answer : C
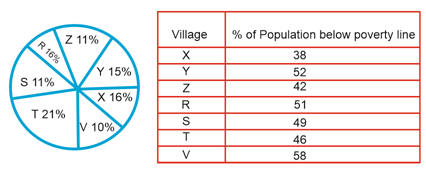
The ratio of the below poverty line population of village ‘T’ to that of the below poverty line population of village ‘Z’ is
(A) 11:23
(B) 13:11
(C) 23:11
(D) 11:13
Correct Answer : C
Direction: The following pie chart shows proportion of the population of seven villages n 2009. Study the pie chart and answer question that follows:
If the population of village ‘R’ is 32000, then the below poverty line population of village ‘Y’ is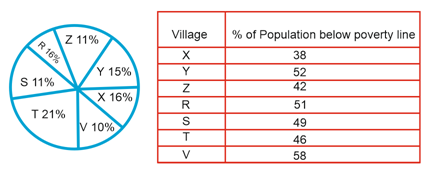
(A) 14100
(B) 15600
(C) 16500
(D) 17000
Correct Answer : B
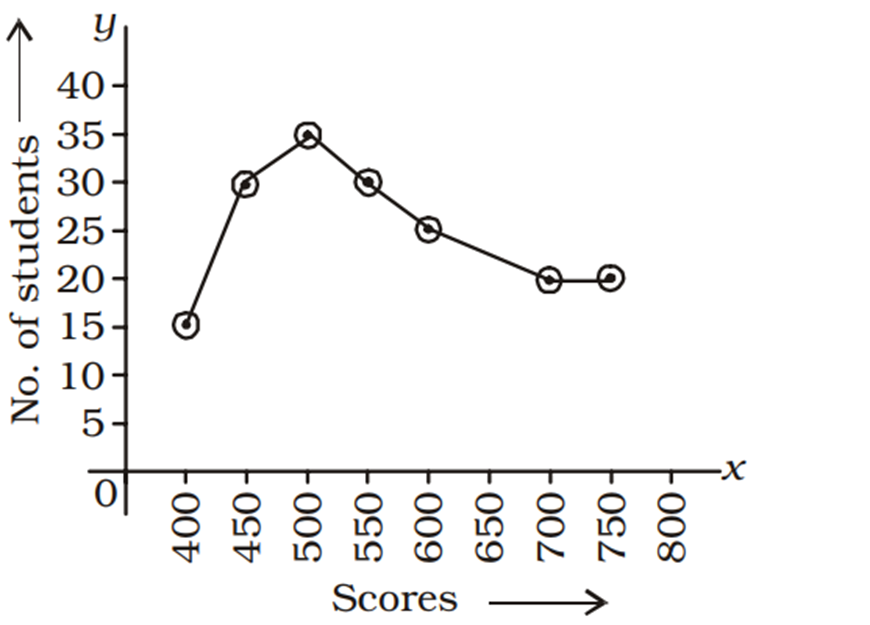
The adjoining diagram is frequency polygon for the scores of students in a test.
What is the total number of students appeared in the test?
(A) 180
(B) 200
(C) 250
(D) 150
Correct Answer : A
Given is a line graph showing the number of accidents in a city during the first 6 months of 1999.

The decrease % of accidents from May to June is
(A) $$15{3\over8}\% $$
(B) $$15{1\over8}\% $$
(C) $$15{5\over8}\% $$
(D) $$15{7\over8}\% $$
Correct Answer : C
The above table gives the rainfall (in mm) in a city on 7 days of a certain week. The range of the above data is-
(A) 22.9
(B) 20.5
(C) 25.1
(D) 21
Correct Answer : C
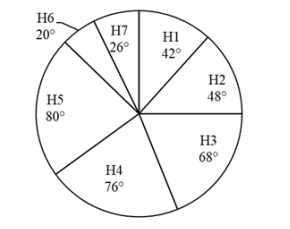
The following pie chart gives the measures of the central angles of the sectors that reflect the number of beds in each of 7 different hospitals with respect to the total number of beds in these 7 hospitals taken together.
If the number of beds in H7 are 39, then what is the total number of beds in all the 7 hospitals taken together?
(A) 720
(B) 540
(C) 450
(D) 630
Correct Answer : B
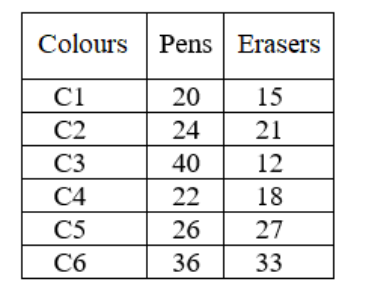
The following table shows the number of pens and the number of erasers of 6 different colours that were sold from a stationery store during a given week.
The total number of erasers having colours C3 or C4 is approximately what percentage of the average number of pens of each colour?
(A) 119.16%
(B) 107.14%
(C) 115.22%
(D) 101.24%
Correct Answer : B
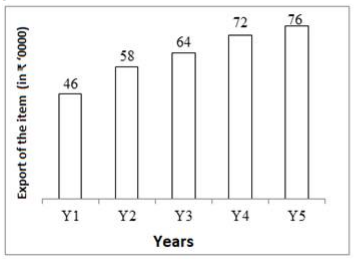
The following bar chart shows the exports (in ₹'0000) of an item from a country 5 consecutive years.
What is the average value of the export of that item from the given country per year?
(A) ₹5,96,000
(B) ₹6,32,000
(C) ₹6,24,000
(D) ₹6,48,000
Correct Answer : B


