Aptitude Practice Question and Answer
8 Q: Meetali and Neeraj got married 30 years ago. Meetali is 4 years younger than Neeraj. When they got married the difference between 2 times of the Meetali's age and 1.5 times of the Neeraj's age was 5 years. Find the present age of Meetali and Neeraj.
2823 05eb10eec5e1730730e79194b
5eb10eec5e1730730e79194b- 142, 46false
- 248, 52false
- 355, 59false
- 460, 64false
- 5None of thesetrue
- Show AnswerHide Answer
- Workspace
- SingleChoice
Answer : 5. "None of these"
Q: A used car dealer sells a car for Rs 7.6 lakhs and makes some loss. If he had sold if for Rs.9.2 lakhs his profit would been thrice of his loss. What was the cost price of the car (in Rs. Lakhs)?
2813 05dca4f4a582669277c2973cc
5dca4f4a582669277c2973cc- 18.5false
- 28.75false
- 38.25false
- 48true
- Show AnswerHide Answer
- Workspace
- SingleChoice
Answer : 4. "8"
Q: A watch which gains uniformly is 4 minutes slow at 9 A.M on Sunday and is 4-minute 15 sec. fast at 9 P.M on the upcoming Friday. When was it correct?
2800 05f18071590e8777587b2e839
5f18071590e8777587b2e839- 11 A.M Wednesdaytrue
- 21 P.M Mondayfalse
- 32 A.M Thursdayfalse
- 46 P.M Tuesdayfalse
- Show AnswerHide Answer
- Workspace
- SingleChoice
Answer : 1. "1 A.M Wednesday "
Q: The ratio of managers to management trainees is 3:5. When 21 new management trainees are recruited, the ratio will become 3:8. How many managers will there be in the group? 2789 05d1b03a78a754124194a7515
5d1b03a78a754124194a7515- 127false
- 224false
- 321true
- 4Cannot be determinedfalse
- Show AnswerHide Answer
- Workspace
- SingleChoice
Answer : 3. "21"
Q: A wheel can travel 22 km. in 100 rounds. Find the radius of that wheel. 2780 05d10948187e3540b926c1bc0
5d10948187e3540b926c1bc0- 142 mtrfalse
- 228 mtr.false
- 335 mtrtrue
- 449 mtrfalse
- Show AnswerHide Answer
- Workspace
- SingleChoice
Answer : 3. "35 mtr"
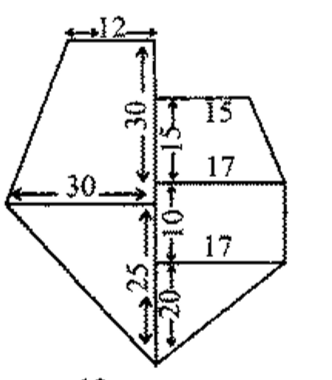
Q: The dimension given in the field book are meters. Total area of the field is

2769 05e4e115e701cfd31ff6680a2
5e4e115e701cfd31ff6680a2
- 11675 sq.mfalse
- 21880 sq.mfalse
- 31625 sq.mfalse
- 41585 sq.mtrue
- Show AnswerHide Answer
- Workspace
- SingleChoice
Answer : 4. "1585 sq.m"
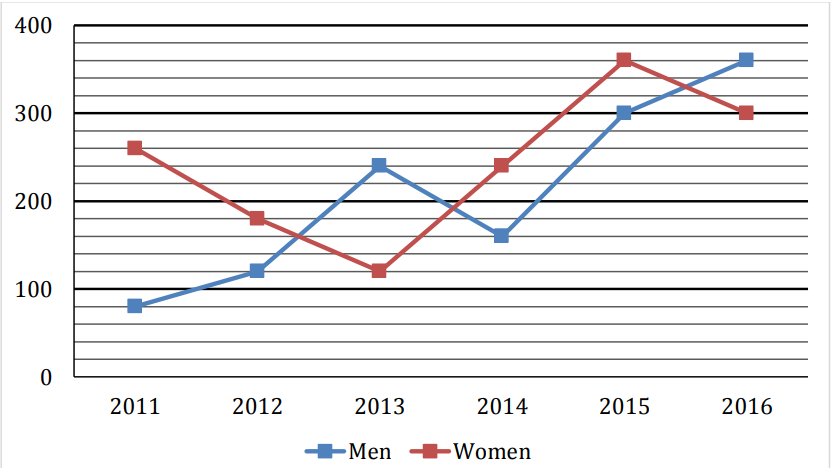
Q:Direction: The line chart given below shows the number of labors (men and women) working in six different years. Study the data carefully and answer the following questions.

Average number of Women working in 2014, 2015 and 2016 together is how much more/less than average number of Men working in 2011, 2014 and 2016 together?
2762 0603dc6d5e759ac364c8b9e0d
603dc6d5e759ac364c8b9e0d
- 190false
- 270false
- 3100true
- 480false
- 5None of the given optionsfalse
- Show AnswerHide Answer
- Workspace
- SingleChoice
Answer : 3. "100 "
Q: In the given figure, DE‖BC and DE=1/3 BC if area of triangle ADE=20 sq. cm, then what is the area (in sq.cm) of the triangle DEC?
2756 05d70d78b9004b376a58c11e4
5d70d78b9004b376a58c11e4- 140true
- 260false
- 380false
- 4120false
- Show AnswerHide Answer
- Workspace
- SingleChoice

