Aptitude Practice Question and Answer
8 Q: If the average of 11, 23 and x is 40, then what is the value of x?
916 06321af5164c0411bf18a165d
6321af5164c0411bf18a165d- 16false
- 240false
- 386true
- 4120false
- Show Answer
- Workspace
- SingleChoice
Answer : 3. "86"
Q:Direction : Each of the questions below consists of a question and two statements numbered I and II are given below it. You have to decide whether the data provided in the statements are sufficient to answer the question. Read both the statements and
Give answer
(A) If the data in statement I alone are sufficient to answer the question, while the data statement II alone are not sufficient to answer the question.
(B) If the data in Statement II alone are sufficient to answer the question, while the data in statement I alone are not sufficient to answer the question.
(C) If the data in statement I alone or in Statement II alone are sufficient to answer the question.
(D) If the data in both the statement I and II are not sufficient to answer the question.
(E) If the data in both the statement I and II together are necessary to answer the question.
In how many days can be B alone complete the work?
I. B and C together can complete the work in 8 days.
II. A and B together can complete the work in 12 days.
916 05da3fcba7919e54a8e3d2701
5da3fcba7919e54a8e3d2701Give answer
(A) If the data in statement I alone are sufficient to answer the question, while the data statement II alone are not sufficient to answer the question.
(B) If the data in Statement II alone are sufficient to answer the question, while the data in statement I alone are not sufficient to answer the question.
(C) If the data in statement I alone or in Statement II alone are sufficient to answer the question.
(D) If the data in both the statement I and II are not sufficient to answer the question.
(E) If the data in both the statement I and II together are necessary to answer the question.
I. B and C together can complete the work in 8 days.
II. A and B together can complete the work in 12 days.
- 1Afalse
- 2Bfalse
- 3Cfalse
- 4Dtrue
- 5Efalse
- Show Answer
- Workspace
- SingleChoice
Answer : 4. "D"
Q: A and B together can do a piece of work in 16 days and B and C together can do the same work in 24 days. From starting A and B worked for 4 days and 7 days respectively, when A lefts the work then C joins the work and he works for 23 days and complete the work. Then find in how many days will C complete the work alone?
915 0614dba6b9029102b5bc61a38
614dba6b9029102b5bc61a38- 132 daystrue
- 272 daysfalse
- 316 daysfalse
- 48 daysfalse
- Show Answer
- Workspace
- SingleChoice
Answer : 1. "32 days "
Q: A works twice as fast as B and B works twice as fast as C. All three working together can finish a task in 4 days with the help of D. If D alone can finish the same task in 16 days, then in how many days will A alone finish 75 % of the same task?
915 06051cabad3e3d30b29d9ae86
6051cabad3e3d30b29d9ae86- 19false
- 27true
- 36false
- 48false
- Show Answer
- Workspace
- SingleChoice
Answer : 2. "7"
Q: Simplify :
915 0606c3c8d556643278a76777b
606c3c8d556643278a76777b- 1false
- 2false
- 3false
- 4true
- Show Answer
- Workspace
- SingleChoice
Answer : 4. "
Q: Find the value of the given expression.
915 06492db78dad6f2e01f55dd36
6492db78dad6f2e01f55dd36- 15false
- 26false
- 34false
- 47true
- Show Answer
- Workspace
- SingleChoice
Answer : 4. "7"
Q:Directions: Study the bar-graph given below & answer the questions.
Pie-chart given below shows the percentage distribution of total no. of boys in six different Schools.
Total Boys in all schools together = 6400
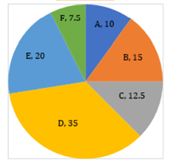
If ratio of girls to total students in school E is 3 : 5. Then find difference of boys in school D to girls in school E?
914 05e93decc1ca91a3c02dd540b
5e93decc1ca91a3c02dd540bPie-chart given below shows the percentage distribution of total no. of boys in six different Schools.
Total Boys in all schools together = 6400
- 1460false
- 2420false
- 3None of thesefalse
- 4360false
- 5320true
- Show Answer
- Workspace
- SingleChoice
Answer : 5. "320"
Q:Directions: The following graph gives Sales, Expense and Capital of a company for a period of five years 1994 to 1998. Read the graph and answer the following questions.
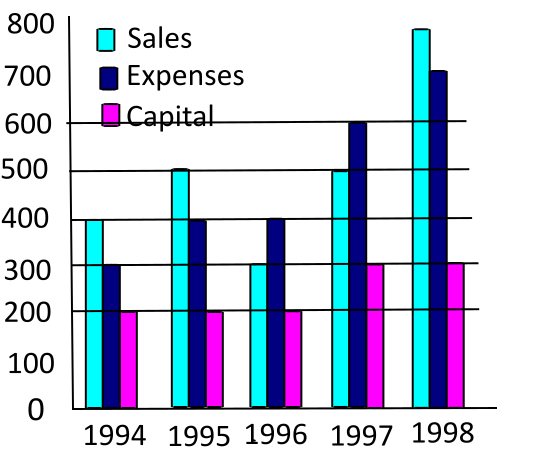
In which year was the ratio of profits to capital the highest?
914 05f40e5d69b782961da3f9518
5f40e5d69b782961da3f9518- 11998false
- 21995true
- 31996false
- 41997false
- Show Answer
- Workspace
- SingleChoice