Aptitude Practice Question and Answer
8 Q: By selling an article at 3/4th of the marked price, there is a gain of 25%. The ratio of the marked price and the cost price is-
677 06303554029cb4630442482aa
6303554029cb4630442482aa- 15 : 3true
- 23 : 5false
- 33 : 4false
- 44 : 3false
- Show AnswerHide Answer
- Workspace
- SingleChoice
Answer : 1. "5 : 3"
Q: The radii of two right circular cylinders are in the ratio 3:2 and the ratio of their volumes is 27: 16. What is the ratio of their heights?
677 064c20d779e9013486a7427fd
64c20d779e9013486a7427fd- 18:9false
- 23:4true
- 34:3false
- 49:8false
- Show AnswerHide Answer
- Workspace
- SingleChoice
Answer : 2. "3:4"
Q: $$x+{1\over x}=2$$ and x is real, then the value of $$x^{17}+{1\over x^{19}}$$ is
676 06409cd601426f5b896a3da2d
6409cd601426f5b896a3da2d- 11false
- 20false
- 32true
- 4-2false
- Show AnswerHide Answer
- Workspace
- SingleChoice
Answer : 3. "2"
Q: ABC is a triangle in which DE || BC and AD: DB = 5: 4. Then DE: BC is
676 0641049f55bff3d098ddbafa0
641049f55bff3d098ddbafa0- 14:5false
- 29:5false
- 34:9false
- 45:9true
- Show AnswerHide Answer
- Workspace
- SingleChoice
Answer : 4. "5:9"
Q:Directions : Read the graph and answer the following questions.
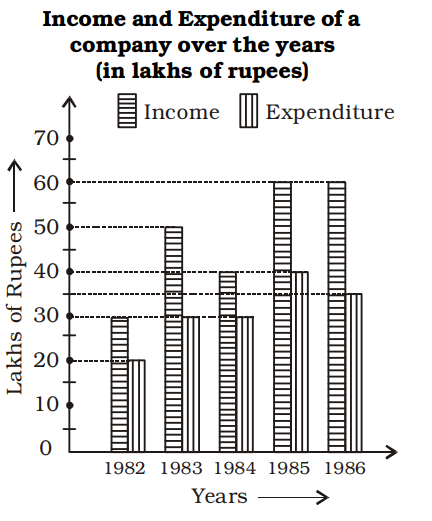
What is the difference in profit between 1983 and 1984 (in lakhs of rupees) ?
676 06461024745f1450a80c4103d
6461024745f1450a80c4103d- 1No profitfalse
- 25false
- 310true
- 415false
- Show AnswerHide Answer
- Workspace
- SingleChoice
Answer : 3. "10 "
Q: Two equal circles intersect such that each pass through the center of the other. If the length of the common chord of the circle is 10√3 cm, then what is the diameter of the circle?
675 06450e915f3618908bf57c1e3
6450e915f3618908bf57c1e3- 110 cmfalse
- 215 cmfalse
- 320 cmtrue
- 430 cmfalse
- Show AnswerHide Answer
- Workspace
- SingleChoice
Answer : 3. "20 cm "
Q: What is the ASA congruence rule of triangles, where A and S represents angle and side of triangle respectively?
675 06481883062f8ada03553507f
6481883062f8ada03553507f- 1Two triangles are said to be congruent if any pair of 2 angles and any 1 pair of sides of both the triangles are equal.false
- 2Two triangles are said to be congruent if all three sides of both the triangles are equal.false
- 3Two triangles are said to be congruent if 2 angles and the included side of one triangle are equal to 2 angles and the included side of the other triangletrue
- 4Two triangles are said to be congruent if 2 sides and the included angle of one triangle are equal to 2 sides and the included angle of the other triangle.false
- Show AnswerHide Answer
- Workspace
- SingleChoice
Answer : 3. "Two triangles are said to be congruent if 2 angles and the included side of one triangle are equal to 2 angles and the included side of the other triangle"
Q: A spherical metallic shell with 6 cm external radius weighs 6688 g. What is the thickness of the shell if the density of metal is 10.5 g per cm3? (Take л = 22/7)
675 064be5f6f88d5e4f52def2c6a
64be5f6f88d5e4f52def2c6a- 14 cmfalse
- 2$$2{1\over 2}$$ cmfalse
- 33 cmfalse
- 42 cmtrue
- Show AnswerHide Answer
- Workspace
- SingleChoice