Aptitude Practice Question and Answer
8 Q: A trader allows a trade discount of 20% and a cash discount of $$6{1\over4}\%$$ on the marked price of the goods and gets a net gain of 20% of the cost. By how much above the cost should the goods be marked for the sale?
616 0641027b8df653d9ac23a2502
641027b8df653d9ac23a2502- 140%false
- 250%false
- 360%true
- 470%false
- Show AnswerHide Answer
- Workspace
- SingleChoice
Answer : 3. "60%"
Q: Each side of a square is 12 cm long. The perimeter of this square is equal to the perimeter of a rectangle whose length is 16 cm. What will be the area of this rectangle?
616 06433d7b11ce944a93e9678c8
6433d7b11ce944a93e9678c8- 1$${{128cm^2}}$$true
- 2$${{112cm^2}}$$false
- 3$${{184cm^2}}$$false
- 4$${{156cm^2}}$$false
- Show AnswerHide Answer
- Workspace
- SingleChoice
Answer : 1. "$${{128cm^2}}$$"
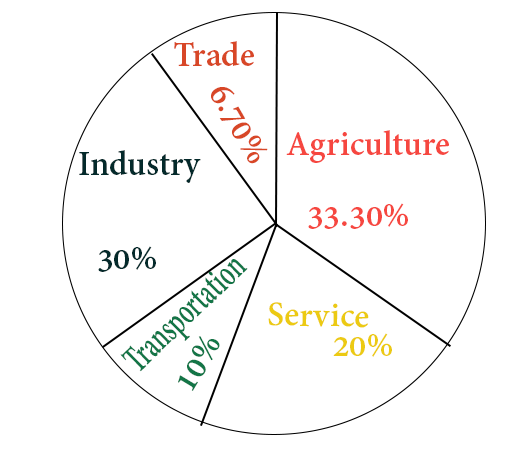
Q:Directions : Study the following pie chart carefully and answer the questions. The pie chart represents the percentage of people involved in various occupations.
Total number of people = 20000

The difference between the maximum number of people involved and minimum number of people involved in various professions is
616 06453a55339143d085f3e5a73
6453a55339143d085f3e5a73Total number of people = 20000

- 12640false
- 23640false
- 36320false
- 45320true
- Show AnswerHide Answer
- Workspace
- SingleChoice
Answer : 4. "5320"
Q: A prism with a right triangular base is 25 cm high. If the shorter sides of the triangle are in the ratio of 1 : 2 and the volume of the prism is 100 cm3 , what is the length of the longest side of the triangle?
616 064649c1ecdae930acb7e5ac0
64649c1ecdae930acb7e5ac0- 1√5 cmfalse
- 22√5 cmtrue
- 35√2 cmfalse
- 45 cmfalse
- Show AnswerHide Answer
- Workspace
- SingleChoice
Answer : 2. "2√5 cm "
Q: $$4a-{4\over a}+3=0$$ then the value of : $$ a^3-{1\over a^3}+3=?$$
616 064660ac60827e80a9f9a8cfd
64660ac60827e80a9f9a8cfd- 1$$3\over 16$$false
- 2$$7\over 16$$false
- 3$$21\over 24$$true
- 4$$21\over 16$$false
- Show AnswerHide Answer
- Workspace
- SingleChoice
Answer : 3. " $$21\over 24$$"
Q: if $$ sinA= {4\over 5}$$, then what is the value of $$sin^2A$$
616 0648991e1f4063d472f4a4e45
648991e1f4063d472f4a4e45- 1$$16\over 25$$true
- 2$$26\over 25$$false
- 3$$48\over 25$$false
- 4$$36\over 25$$false
- Show AnswerHide Answer
- Workspace
- SingleChoice
Answer : 1. "$$16\over 25$$"
Q:What should come in place of the question mark '?' in the following number series?
7, 13, ?, 49, 97, 193
616 064dc80069b618cf631e91d71
64dc80069b618cf631e91d71- 127false
- 223false
- 325true
- 429false
- 534false
- Show AnswerHide Answer
- Workspace
- SingleChoice
Answer : 3. "25"
Q: If x = 2 then the value of x3 + 27x2 + 243x + 631 is
615 06466088c0e79a6cedff9fa02
6466088c0e79a6cedff9fa02- 11233true
- 21211false
- 31231false
- 41321false
- Show AnswerHide Answer
- Workspace
- SingleChoice

