Aptitude Practice Question and Answer
8 Q:Directions: Following is the pie-chart showing the spending of a family on various items in a particular year
Study the pie chart and answer questions
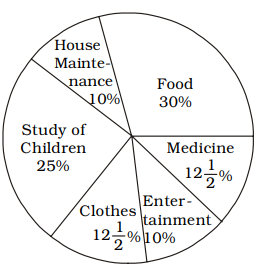
If the total amount spent on the family during the year was ₹ 50,000, how much they spent for buying clothes?
597 063be6f4861d62119f1dbc38c
63be6f4861d62119f1dbc38c- 1₹ 6,250true
- 2₹ 6,500false
- 3₹ 7,250false
- 4₹ 7,500false
- Show AnswerHide Answer
- Workspace
- SingleChoice
Answer : 1. "₹ 6,250 "
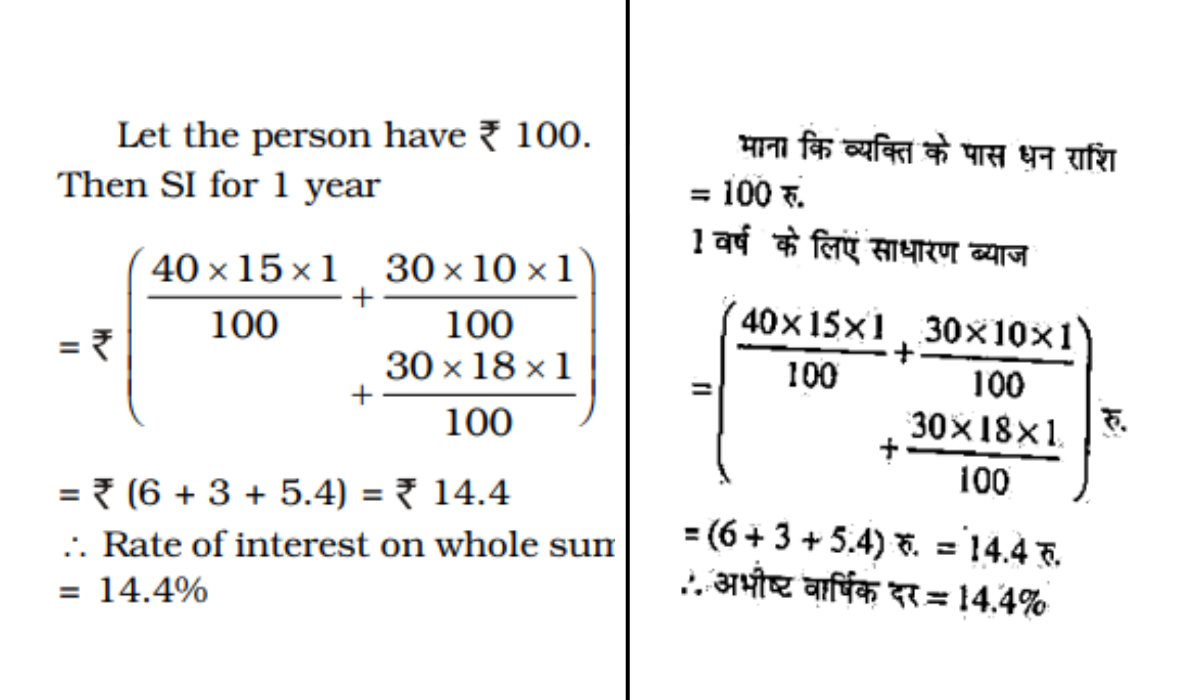
Q: A person lends 40% of his sum of money at 15% per annum, 50% of the rest at 10% per annum and the rest at 18% per annum rate of interest. What would be the annual rate of interest, if the interest is calculated on the whole sum?
597 065423f9adfda58cb3c9dd49b
65423f9adfda58cb3c9dd49b- 113.4%false
- 214.33%false
- 314.4%true
- 413.33%false
- Show AnswerHide Answer
- Workspace
- SingleChoice
Answer : 3. "14.4% "
Explanation :
Q:Directions: The following Pie Chart shows the export of different food grains from India in 2010. Study the chart and answer the questions:
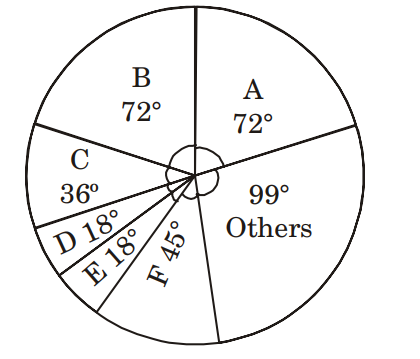
If a total of 1.5 million quintals of crop F was exported, the amount of total food grains exported (in million) quintals was
596 063be697b74eba5069d5135e8
63be697b74eba5069d5135e8- 18.7false
- 212true
- 310.8false
- 49.6false
- Show AnswerHide Answer
- Workspace
- SingleChoice
Answer : 2. "12 "
Q: The value of $${cosec^230^0sin^245^0+sec^260^0}\over {tan60^0cosec^245^0-sec^260^0tan45^0}$$ is
596 064ba2c152d3130f5754291e9
64ba2c152d3130f5754291e9- 1$$-2\sqrt { 3}-2$$false
- 2$$-3(2+\sqrt { 3})$$true
- 3$$3(2+\sqrt { 3})$$false
- 4$$2\sqrt { 3}-2$$false
- Show AnswerHide Answer
- Workspace
- SingleChoice
Answer : 2. " $$-3(2+\sqrt { 3})$$"
Q: The base and altitude of a right angled triangle are 12 cm and 5 cm respectively. The perpendicular distance of its hypotenuse from the opposite vertex is
595 0645cdf9c45f1450a80b9c9e6
645cdf9c45f1450a80b9c9e6- 1$$ 4{4\over 13} $$ cmfalse
- 2$$ 4{8\over 13} $$ cmtrue
- 35 cmfalse
- 47 cmfalse
- Show AnswerHide Answer
- Workspace
- SingleChoice
Answer : 2. "$$ 4{8\over 13} $$ cm"
Q: A cylindrical container of 32 cm height and 18 cm radius is filled with sand. Now all this sand is used to form a conical heap of sand. If the height of the conical heap is 24 cm, what is the radius of its base?
595 06464a1010827e80a9f9532e4
6464a1010827e80a9f9532e4- 112 cmfalse
- 224 cmfalse
- 336 cmtrue
- 448 cmfalse
- Show AnswerHide Answer
- Workspace
- SingleChoice
Answer : 3. "36 cm "
Q:Directions : The bar graph, given here, shows the demand and production of colour televisions of five companies for Diwali season in the year 2009. Study the graph carefully and answer the questions based on the graph.
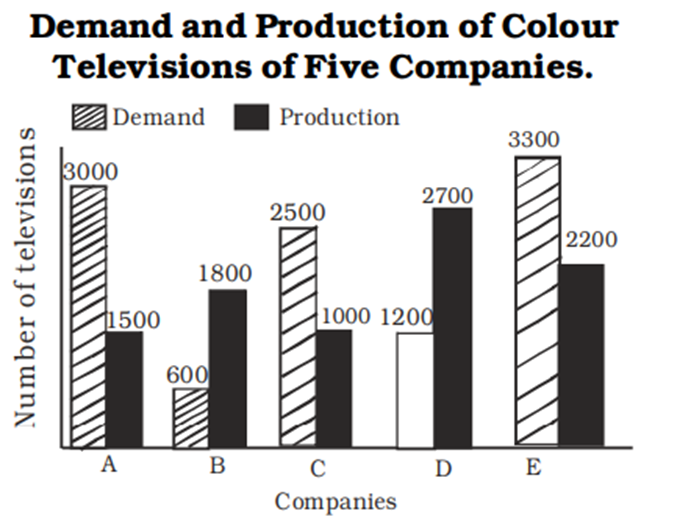
The production of colour televisions of company D is how many times that of company A ?
594 06460fa324f2cce984334e301
6460fa324f2cce984334e301- 11.9false
- 21.8true
- 31.5false
- 42.3false
- Show AnswerHide Answer
- Workspace
- SingleChoice
Answer : 2. "1.8 "
Q: Amit sold an article for ₹369.60 after allowing 12% discount on the marked price. Had he not allowed any discount he would have earned a profit of 20%. What is the cost price of the article?
594 064bfb0c2c3da05b2214f3525
64bfb0c2c3da05b2214f3525- 1₹350true
- 2₹400false
- 3₹380false
- 4₹320false
- Show AnswerHide Answer
- Workspace
- SingleChoice