Data Interpretation Questions Practice Question and Answer
8 Q:Direction: Percentage of different types of employees in a company in two consecutive years.
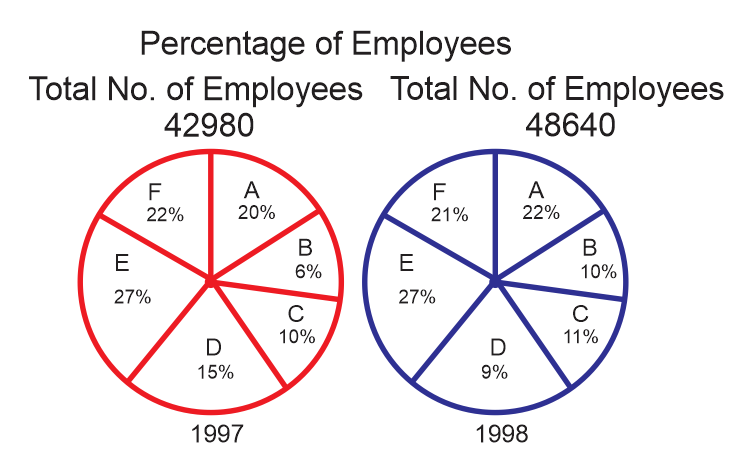
In 1997 the total number of which of the following types of pairs of employees was approximately equal to the employees in 1998?
1064 05e3274271f73627362283556
5e3274271f73627362283556
- 1D and Efalse
- 2C and Dtrue
- 3A and Cfalse
- 4B and Cfalse
- Show AnswerHide Answer
- Workspace
- SingleChoice
Answer : 2. "C and D "
Q:Directions: The following bar graph shows the percentage breakup of a Sunil’s salary from year 2012 to 2016. With the given information, find the following questions.
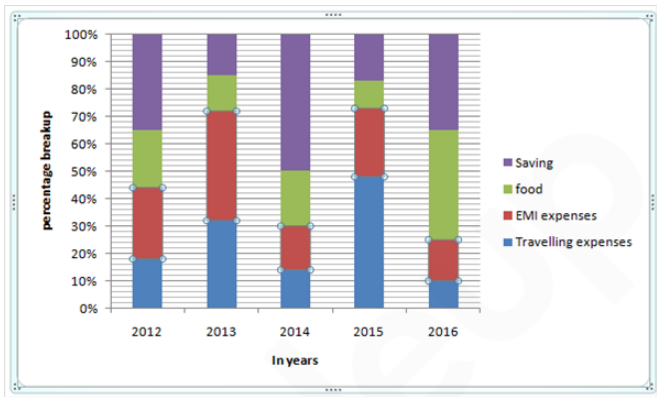
If the saving in 2012 is 4/5th of the saving in 2014. Then what is the total expenditure spent on food in 2012? (Given that total expense in 2014 is ₹ 1,85,000)
1062 060a23b25b1d2440614b98a08
60a23b25b1d2440614b98a08
- 1₹ 21,100false
- 2₹ 45,100false
- 3₹ 40,400false
- 4₹ 44,400true
- 5None of thesefalse
- Show AnswerHide Answer
- Workspace
- SingleChoice
Answer : 4. "₹ 44,400"
Q:The following pie-chart shows the monthly expenditure of family on various items. If the family spends Rs. 825 on clothing answer the question
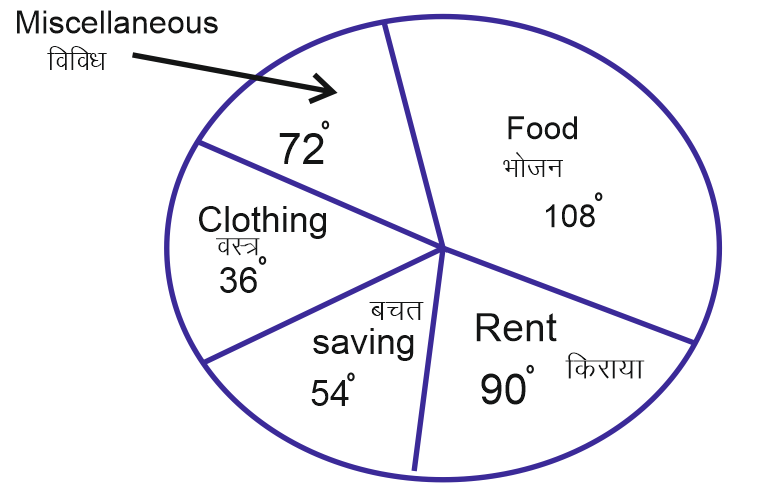
What is the ratio of expenses on food and miscellaneous ?
1054 05de4e19d57778c24100554d6
5de4e19d57778c24100554d6
- 13:4false
- 23:2true
- 32:3false
- 42:5false
- Show AnswerHide Answer
- Workspace
- SingleChoice
Answer : 2. "3:2"
Q:Direction: Study the following graph carefully and answer the questions that follow:
The graph given below represents the number of users of two broadband services A and B across 5 cities P, Q, R, S and T.
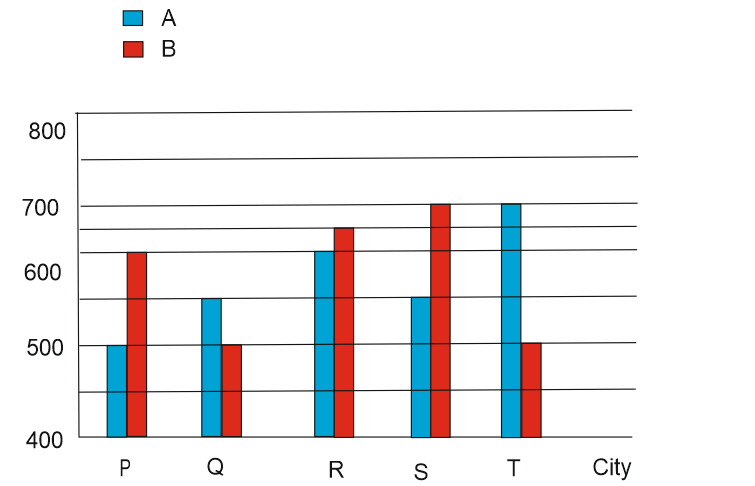
What is the average number of users of brand A across all five cities together?
1053 05df0bcc53d76f974e561f6f3
5df0bcc53d76f974e561f6f3The graph given below represents the number of users of two broadband services A and B across 5 cities P, Q, R, S and T.

- 1560false
- 2570false
- 3580true
- 4590false
- 5550false
- Show AnswerHide Answer
- Workspace
- SingleChoice
Answer : 3. "580"
Q:Study the following bar chart and answer the questions carefully.
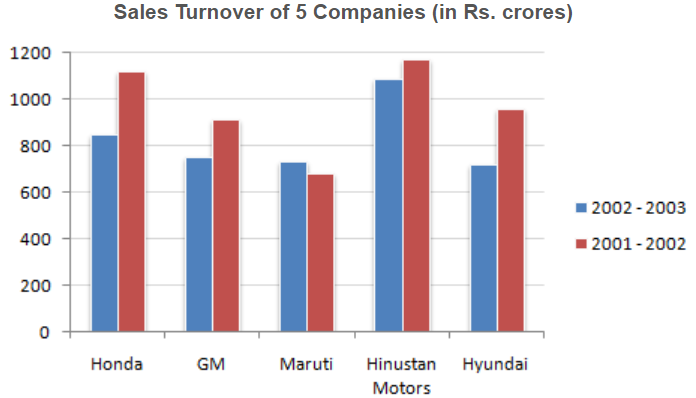
What is the percentage change in the overall sales turnover of the five companies together between 2001 - 2002 and 2002 - 2003 ?
1052 05fd33a80eddcb86a7ee3ab40
5fd33a80eddcb86a7ee3ab40
- 117.21 %false
- 214.68 %true
- 312.67 %false
- 421.24 %false
- 522.33 %false
- Show AnswerHide Answer
- Workspace
- SingleChoice
Answer : 2. "14.68 %"
Q:Study the following table carefully and answer the questions given below.
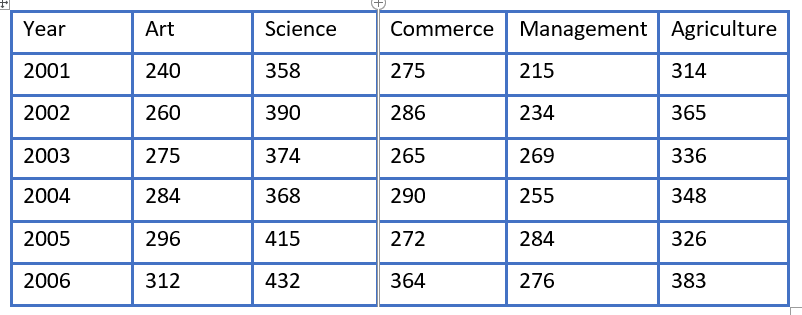
In which year was the difference in number of students in Arts and Science exactly 130?
1049 05da04eb40ba8fe2a19c21d53
5da04eb40ba8fe2a19c21d53
- 12001false
- 22002true
- 32004false
- 42006false
- 5None of thesefalse
- Show AnswerHide Answer
- Workspace
- SingleChoice
Answer : 2. "2002"
Q:Directions-Study the following diagram and answer the four questions.
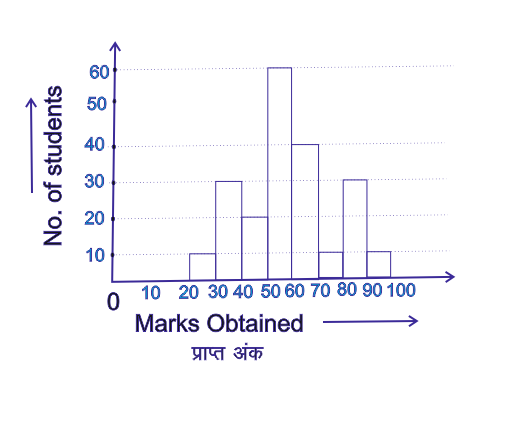
The range of marks obtained by maximum no. of students is
1040 05daea692cca75847f4d92d20
5daea692cca75847f4d92d20
- 130-40false
- 260-70false
- 350-60true
- 480-90false
- Show AnswerHide Answer
- Workspace
- SingleChoice
Answer : 3. "50-60 "
Q:The given pie chart shows the percentage of students enrolled for the courses A, B, C, D and E in a university and the table shows the percentage of students that passed, out of the enrolled students.
Total Students=60,000
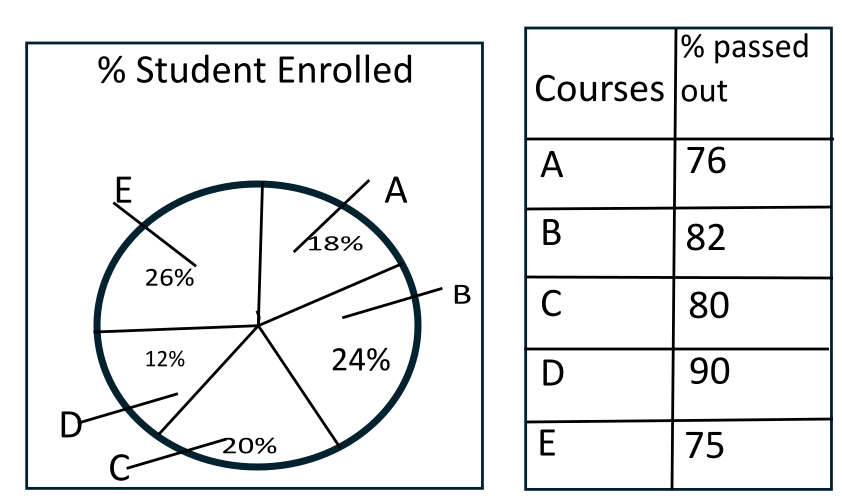
What is the ratio of Passed student in A and B ?
1038 05ffc35c1b78a0253d6ee66ff
5ffc35c1b78a0253d6ee66ffTotal Students=60,000

- 156 : 43false
- 257 : 82true
- 351 : 41false
- 447 : 67false
- Show AnswerHide Answer
- Workspace
- SingleChoice

