Data Interpretation Questions Practice Question and Answer
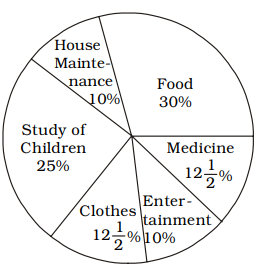
8 Q:Directions: Following is the pie-chart showing the spending of a family on various items in a particular year
Study the pie chart and answer questions

If the total amount spent on the family during the year was ₹ 50,000, how much they spent for buying clothes?
378 063be6f4861d62119f1dbc38c
63be6f4861d62119f1dbc38c
- 1₹ 6,250true
- 2₹ 6,500false
- 3₹ 7,250false
- 4₹ 7,500false
- Show AnswerHide Answer
- Workspace
- SingleChoice
Answer : 1. "₹ 6,250 "
Q:Directions: Following is the pie-chart showing the spending of a family on various items in a particular year
Study the pie chart and answer questions

The ratio of the total amount spent for food and medicine is
386 063be6ef28f5b1f774c4c911f
63be6ef28f5b1f774c4c911f
- 11 : 2false
- 23 : 1false
- 312 : 5true
- 411 : 5false
- Show AnswerHide Answer
- Workspace
- SingleChoice
Answer : 3. "12 : 5 "
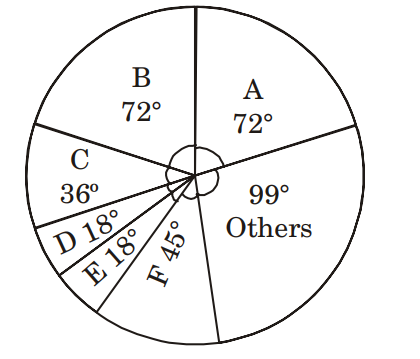
Q:Directions: The following Pie Chart shows the export of different food grains from India in 2010. Study the chart and answer the questions:

If the revenue from 1 quintal of crop A is thrice that from 1 quintal of crop C, then the ratio of the total revenues of A and C is
429 063be6b9f1b93047bc20cdf06
63be6b9f1b93047bc20cdf06
- 11 : 6false
- 22 : 3false
- 33 : 2false
- 46 : 1true
- Show AnswerHide Answer
- Workspace
- SingleChoice
Answer : 4. "6 : 1"
Q:Directions: The following Pie Chart shows the export of different food grains from India in 2010. Study the chart and answer the questions:

If a total of 1.5 million quintals of crop F was exported, then the total quantity of D and E that was exported (in million quintals) was
382 063be6b4261d62119f1db985c
63be6b4261d62119f1db985c
- 11.2true
- 21.5false
- 34.5false
- 46.5false
- Show AnswerHide Answer
- Workspace
- SingleChoice
Answer : 1. "1.2 "
Q:Directions: The following Pie Chart shows the export of different food grains from India in 2010. Study the chart and answer the questions:

The three crops which combine to contribute to exactly 50% of the total export of food grains are
474 063be6aa71b93047bc20cd365
63be6aa71b93047bc20cd365
- 1A, F and othersfalse
- 2B, C and Ffalse
- 3A, B and Ctrue
- 4C, F and othersfalse
- Show AnswerHide Answer
- Workspace
- SingleChoice
Answer : 3. "A, B and C "
Q:Directions: The following Pie Chart shows the export of different food grains from India in 2010. Study the chart and answer the questions:

If a total of 1.5 million quintals of crop F was exported, the amount of total food grains exported (in million) quintals was
392 063be697b74eba5069d5135e8
63be697b74eba5069d5135e8
- 18.7false
- 212true
- 310.8false
- 49.6false
- Show AnswerHide Answer
- Workspace
- SingleChoice
Answer : 2. "12 "
Q:Directions: The following Pie Chart shows the export of different food grains from India in 2010. Study the chart and answer the questions:

Of the total export of foodgrains, the percentage of crop B exported is
485 063be693d8f5b1f774c4c4c20
63be693d8f5b1f774c4c4c20
- 115%false
- 220%true
- 318%false
- 410%false
- Show AnswerHide Answer
- Workspace
- SingleChoice
Answer : 2. "20%"
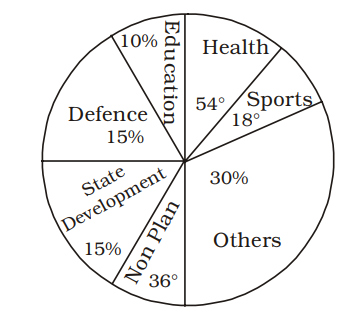
Q:Directions : The expenses of a country for a particular year is given in Pie–Chart. Read the Pie– Chart and answer the questions.

The percent of the total spending that is spent on health is
358 063ac3564fb04114b2d3cfbed
63ac3564fb04114b2d3cfbed
- 115%true
- 220%false
- 325%false
- 430%false
- Show AnswerHide Answer
- Workspace
- SingleChoice

