Data Interpretation Questions Practice Question and Answer
8 Q:Direction: The given Bar Graph Presents the number of different types of vehicles (in lakhs) exported by a company during 2014 and 2015.
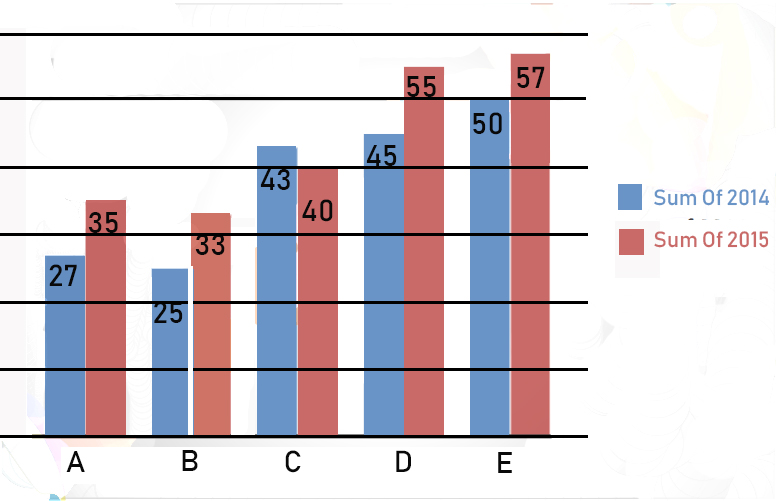
The average number type A, B and D vehicles exported in 2015 was x% less than the number of type E vehicles exported in 2014. What is the value of x?
948 0602514ac083f2c6596c29b5d
602514ac083f2c6596c29b5d
- 120false
- 225false
- 318true
- 424false
- Show AnswerHide Answer
- Workspace
- SingleChoice
Answer : 3. "18"
Q:Directions: Study the following table carefully to answer the questions that follow .
Number of soldiers ( in thousands ) joining five different forces during six different.

What was the ratio of the number of soldiers joining Army in the year 2008 to the number of soldiers joining Army in the year 2006?
948 05e82e924fb2b5f39957b682e
5e82e924fb2b5f39957b682eNumber of soldiers ( in thousands ) joining five different forces during six different.

- 15:2false
- 23:7true
- 34:3false
- 45:1false
- 5None of thesefalse
- Show AnswerHide Answer
- Workspace
- SingleChoice
Answer : 2. "3:7 "
Q:Directions: The bar graph given below shows the spending of family income on various items and savings during 1993. Observe the graph and answer the following questions:
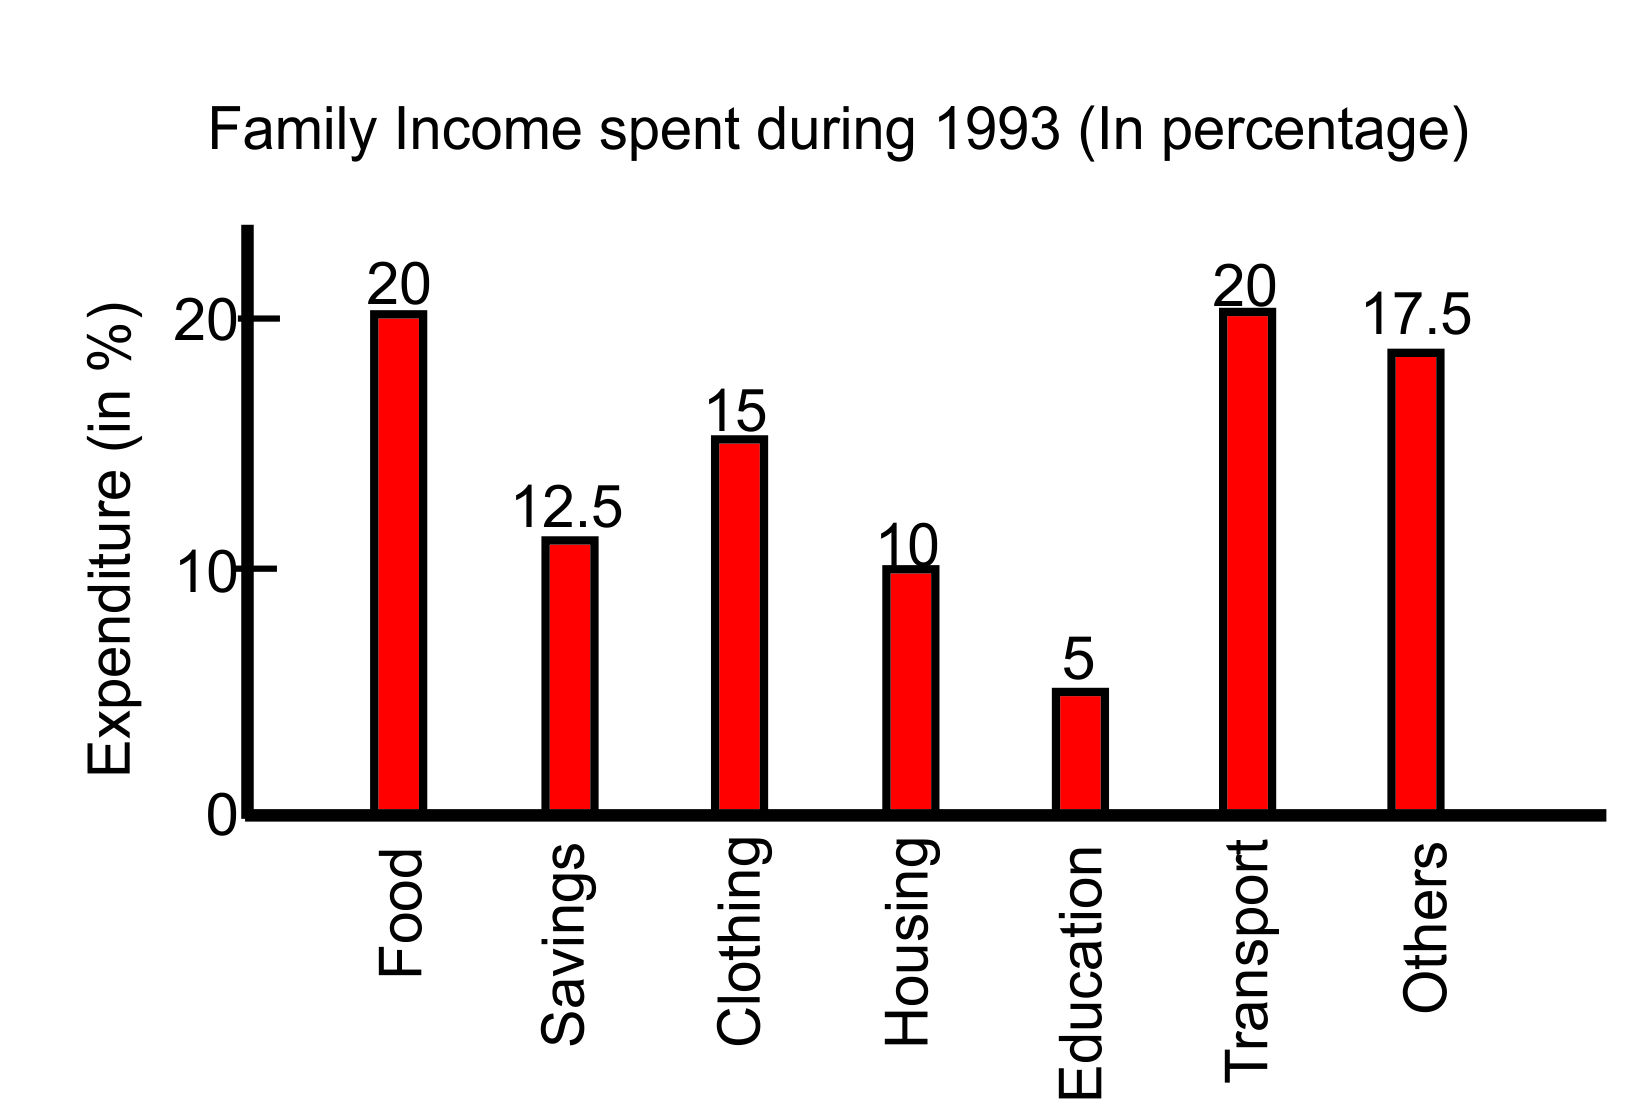
The percent of income spent on food is:
946 05def3b1b5b0f1b05dcfc4452
5def3b1b5b0f1b05dcfc4452
- 15 %false
- 210 %false
- 312.5 %false
- 420 %true
- Show AnswerHide Answer
- Workspace
- SingleChoice
Answer : 4. "20 % "
Q:Direction: Study the following information to answer the questions.
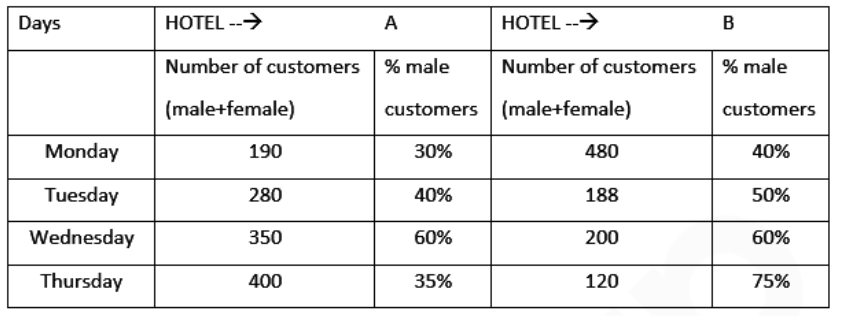
On Wednesday, in hotel A, 30% of male customers and 70% of female customers were from Town X. what was the number of customers in hotel A from town X on Wednesday?
942 0609d19d8e941dd6183d6385e
609d19d8e941dd6183d6385e
- 1153false
- 2157false
- 3161true
- 4183false
- 5181false
- Show AnswerHide Answer
- Workspace
- SingleChoice
Answer : 3. "161 "
Q:Study the given graph carefully to answer the questions that follow:
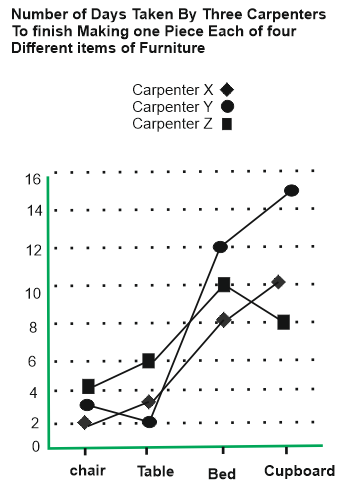
If carpenter X and carpenter Y were to make a chair together how many days would they take?
938 05d85cf58a08f7a408051b2b8
5d85cf58a08f7a408051b2b8
- 11 Daysfalse
- 24 daysfalse
- 33 daysfalse
- 42 daysfalse
- 5None of thesetrue
- Show AnswerHide Answer
- Workspace
- SingleChoice
Answer : 5. "None of these "
Q:Direction: Percentage of different types of employees in a company in two consecutive years.
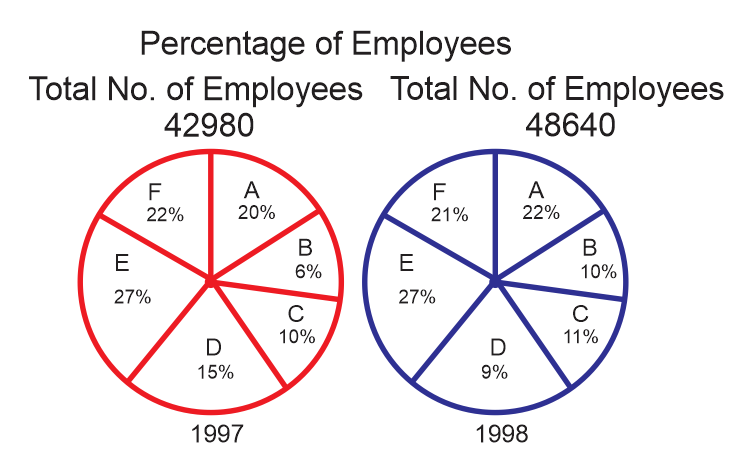
From 1997 to 1998 in the case of which of the following types of employees the change was maximum ?
938 05e3274b41f7362736228359d
5e3274b41f7362736228359d
- 1Cfalse
- 2Dfalse
- 3Btrue
- 4Afalse
- Show AnswerHide Answer
- Workspace
- SingleChoice
Answer : 3. "B"
Q:Directions: Read the following table and answer the questions below it:
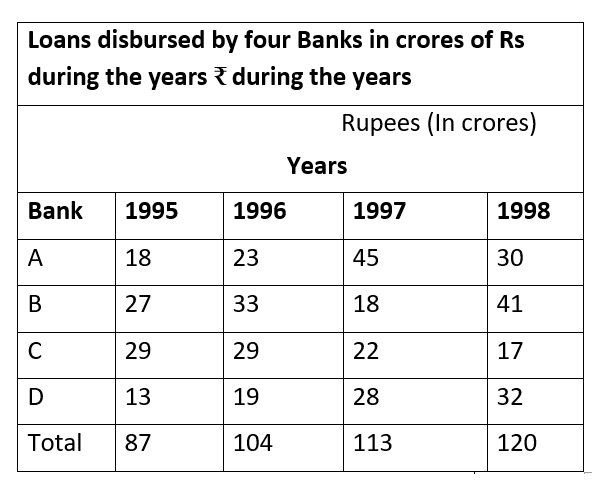
In which year the disbursement of loans by all the banks combined together was nearest to the average disbursement of loans over the years?
931 05e4e4db01b69e805d0be9d01
5e4e4db01b69e805d0be9d01
- 11995false
- 21996true
- 31997false
- 41998false
- Show AnswerHide Answer
- Workspace
- SingleChoice
Answer : 2. "1996 "
Q:Direction: The following diagram shows the percentage of population of Hindus, Sikhs and Muslims with respect to total population in a town during 2005 to 2008. Study the diagram and answer the questions:
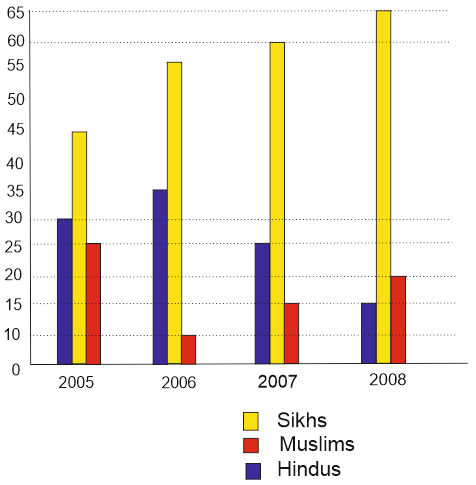
If the total number of Hindus in 2008 was 12 lakh, the number of Muslim in 2008 was (in lakh)
931 05dccdfc6ef0a14548c1d6084
5dccdfc6ef0a14548c1d6084
- 118false
- 212false
- 324false
- 416true
- Show AnswerHide Answer
- Workspace
- SingleChoice

