Data Interpretation Questions Practice Question and Answer
8 Q:Direction: The following diagram shows the percentage of population of Hindus, Sikhs and Muslims with respect to total population in a town during 2005 to 2008. Study the diagram and answer the questions:
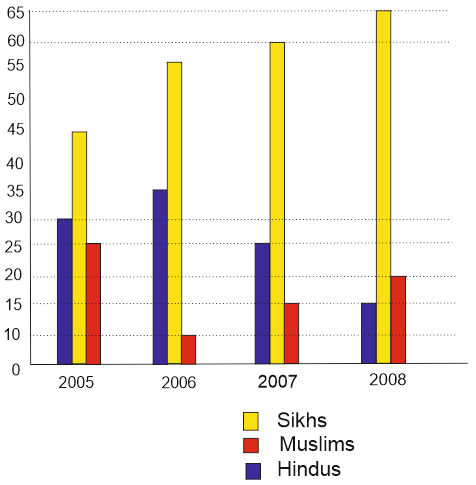
If the total number of Hindus in 2008 was 12 lakh, the number of Muslim in 2008 was (in lakh)
931 05dccdfc6ef0a14548c1d6084
5dccdfc6ef0a14548c1d6084
- 118false
- 212false
- 324false
- 416true
- Show AnswerHide Answer
- Workspace
- SingleChoice
Answer : 4. "16"
Q:Direction: The following diagram shows the percentage of population of Hindus, Sikhs and Muslims with respect to total population in a town during 2005 to 2008. Study the diagram and answer the questions:

If the total population in 2007 was 80 lakh, then the number of Hindus n 2007 was (in lakh)
927 05dccdd94b80c4d4e55b631c1
5dccdd94b80c4d4e55b631c1
- 125false
- 216false
- 318false
- 420true
- Show AnswerHide Answer
- Workspace
- SingleChoice
Answer : 4. "20"
Q:Pie chart shows the percent of money spent by family on various item during 1999. Study the graph and answer these questions.
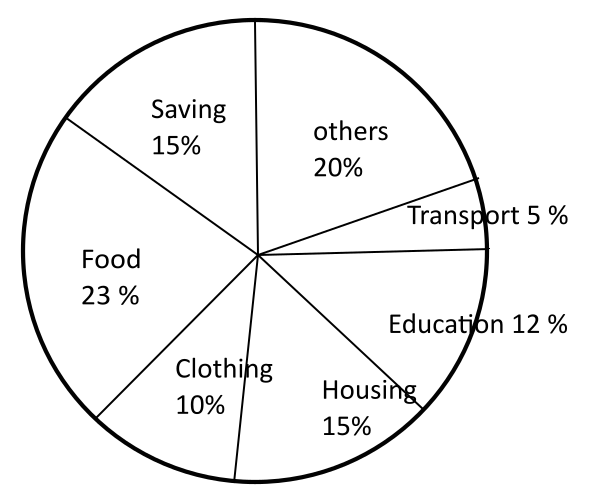
Graph shows that the maximum amount was spent on
925 05fb4e5bfbf36696eb82682fb
5fb4e5bfbf36696eb82682fb
- 1Foodtrue
- 2Clothingfalse
- 3Housingfalse
- 4Othersfalse
- Show AnswerHide Answer
- Workspace
- SingleChoice
Answer : 1. "Food"
Q:Study the following table and answer the equation:
Number of cars sold by dealers A, B, C, D and E during first six
months of 2018.
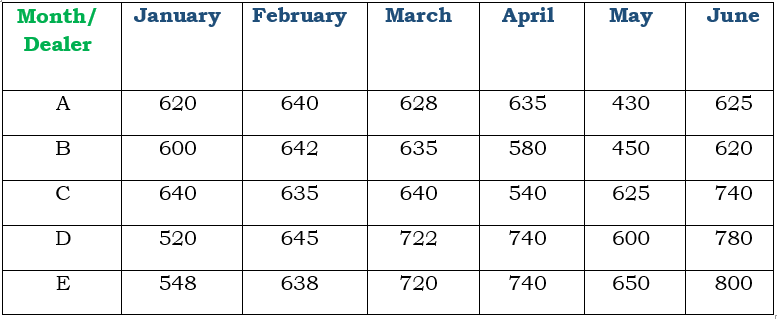
In July 2018, if the sales of cars by the dealer D increases by the same percentage as in June 2018 over its previous month, then what is the number of cars sold by D in July 2018 ?
924 0619e09272f80a134c81c10c4
619e09272f80a134c81c10c4Number of cars sold by dealers A, B, C, D and E during first six months of 2018.

- 11014true
- 2975false
- 31020false
- 4959false
- Show AnswerHide Answer
- Workspace
- SingleChoice
Answer : 1. "1014 "
Q:Directions: Answer the questions based on the information given below:
The following line graph shows revenue and expenditure of company A for 5 years (in Lakhs):
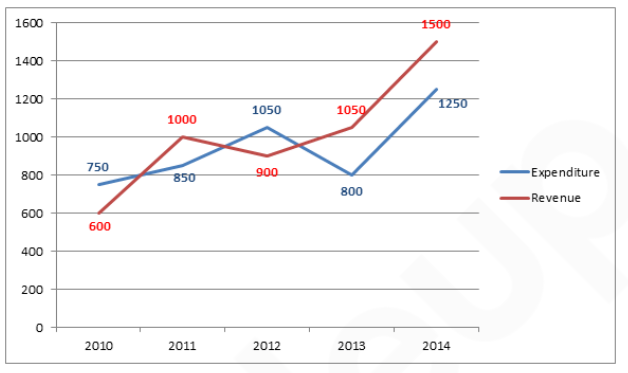
What is the average revenue of the company over the years?
923 060a4ddf6b1d2440614c00c2e
60a4ddf6b1d2440614c00c2eThe following line graph shows revenue and expenditure of company A for 5 years (in Lakhs):

- 11050 lakhsfalse
- 22020 lakhsfalse
- 31000 lakhsfalse
- 41010 lakhstrue
- 5None of thesefalse
- Show AnswerHide Answer
- Workspace
- SingleChoice
Answer : 4. "1010 lakhs "
Q:Directions: Study the bar-graph given below & answer the questions.
Pie-chart given below shows the percentage distribution of total no. of boys in six different Schools.
Total Boys in all schools together = 6400
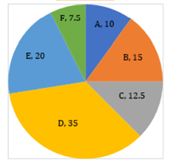
If total no. of students in school F is 820. Then girls in school F is approximately what percent more/less than total boys in school B?
919 05e93dde09255c93bdf02658c
5e93dde09255c93bdf02658cPie-chart given below shows the percentage distribution of total no. of boys in six different Schools.
Total Boys in all schools together = 6400

- 165%true
- 274%false
- 358%false
- 478%false
- 555%false
- Show AnswerHide Answer
- Workspace
- SingleChoice
Answer : 1. "65%"
Q:Directions: Read the following table and answer the questions below it:
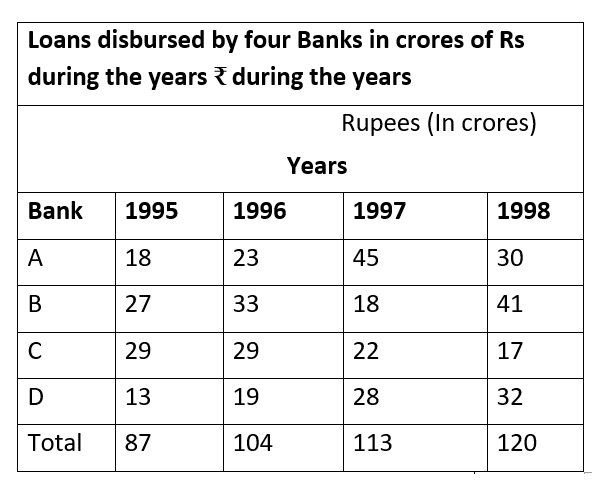
In which bank was the loan disbursement more than 30 % of the disbursement of all banks combined together in 1998?
912 05e4e4fca701cfd31ff68f586
5e4e4fca701cfd31ff68f586
- 1Afalse
- 2Btrue
- 3Cfalse
- 4Dfalse
- Show AnswerHide Answer
- Workspace
- SingleChoice
Answer : 2. "B"
Q:Direction: Study the following table carefully to answer these questions.
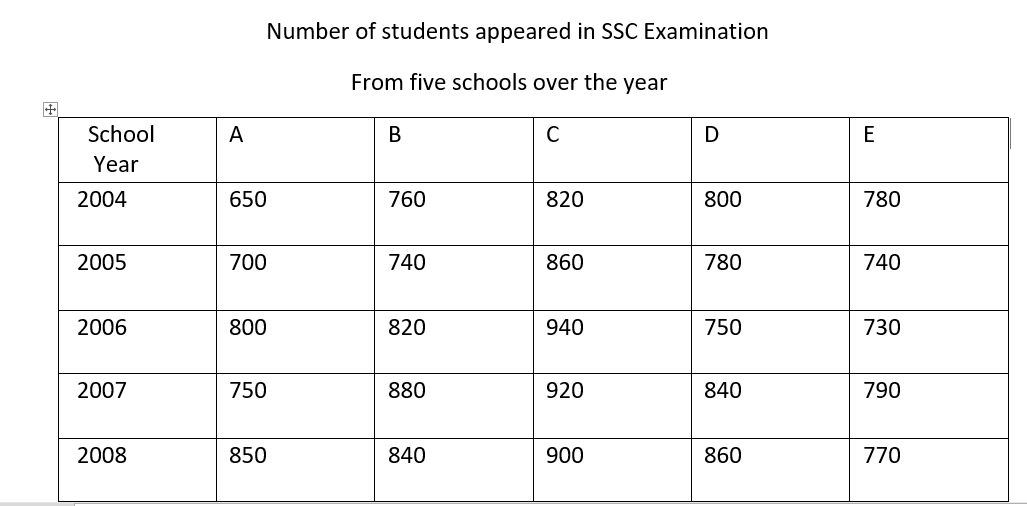
Number of students appeared in 2006 from school A is what per cent of the total number of students appeared from school A for all the years together ?
912 05e6c689b0b8b1e6afc2ad1a0
5e6c689b0b8b1e6afc2ad1a0
- 1$$ 223{2 \over3}$$false
- 2$$ 22{1 \over3}$$false
- 3$$ 22{2 \over3}$$false
- 4$$ 21{1 \over3}$$true
- 5None of thesefalse
- Show AnswerHide Answer
- Workspace
- SingleChoice

