Data Interpretation Questions Practice Question and Answer
8 Q:Directions : Study the following frequency polygon and answer the questions. Given a line graph showing the number of students passed in Higher Secondary Examination in a school over the years 2008 to 2013.

The increase in percentage of passed students from 2008 to 2011 approximately is
1149 06393215bd319b37ca19bd755
6393215bd319b37ca19bd755- 155%false
- 250.5%false
- 354.5%true
- 453.05%false
- Show AnswerHide Answer
- Workspace
- SingleChoice
Answer : 3. "54.5% "
Q:Direction: Study the line graph carefully to answer the following questions.
Line graph shows the production (in thousand units) and percentage of exported mobiles, computers and laptops.
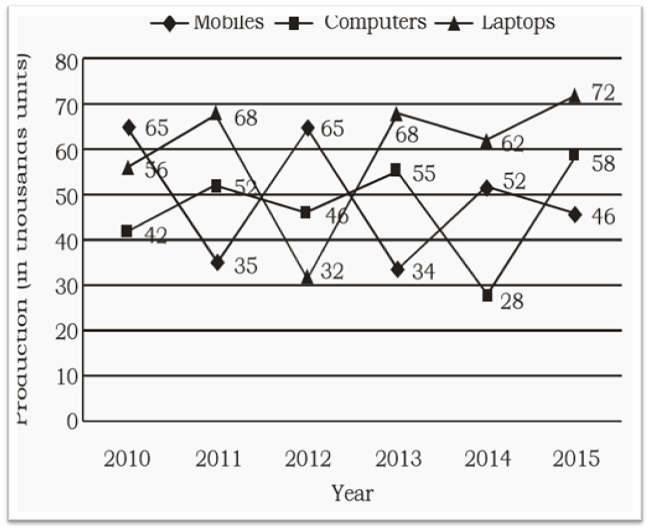
In which of the following years was the production of Laptops exactly 40% of the total production of Mobiles, Computers and Laptops in that year?
1148 05e9d2213bf0a265d837b9c2c
5e9d2213bf0a265d837b9c2cLine graph shows the production (in thousand units) and percentage of exported mobiles, computers and laptops.
- 12011false
- 22012false
- 32015false
- 42014false
- 5None of thesetrue
- Show AnswerHide Answer
- Workspace
- SingleChoice
Answer : 5. "None of these "
Q:Directions: The bar graph shows the results of an annual examination in a secondary school in a certain year. Answer the following four questions based on this chart.

The class has the highest number of passed students, is
1143 05e8afac97b82aa7479fc1df0
5e8afac97b82aa7479fc1df0- 1VIIfalse
- 2IXfalse
- 3VIIIfalse
- 4Xtrue
- Show AnswerHide Answer
- Workspace
- SingleChoice
Answer : 4. "X"
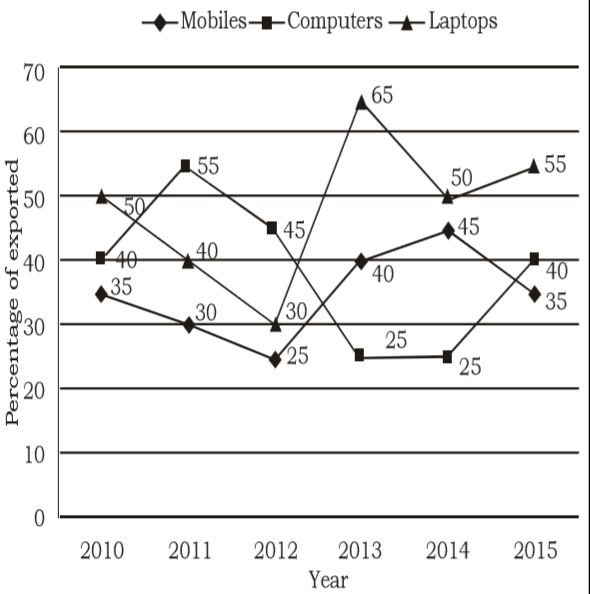
Q:Direction: Study the line graph carefully to answer the following questions.
Line graph shows the production (in thousand units) and percentage of exported mobiles, computers and laptops.
Find the ratio between Mobiles, Laptops and Computers exported in the year 2012.
1140 05e9d1e23772f97276f50a277
5e9d1e23772f97276f50a277Line graph shows the production (in thousand units) and percentage of exported mobiles, computers and laptops.
- 1325 : 316: 419false
- 2325 : 192 : 414true
- 3319 : 216:425false
- 4256 : 355 : 135false
- 5None of thesefalse
- Show AnswerHide Answer
- Workspace
- SingleChoice
Answer : 2. "325 : 192 : 414"
Q:Study the following table carefully and answer the questions given below.
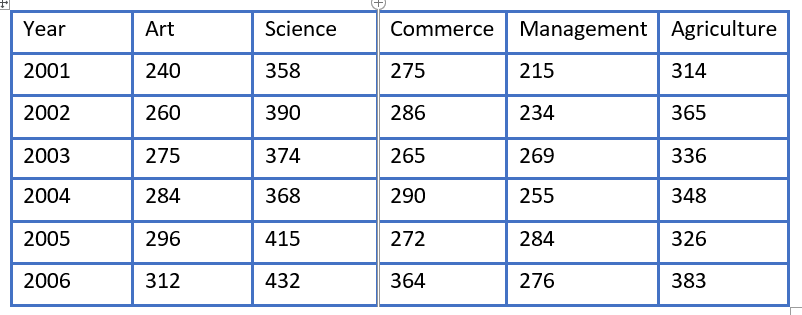
In which year the percentage change in the case of Agriculture discipline was highest from the previous year?
1138 05da0511f31905d285336376e
5da0511f31905d285336376e- 12002false
- 22003false
- 32004false
- 42005false
- 52006true
- Show AnswerHide Answer
- Workspace
- SingleChoice
Answer : 5. "2006"
Q:Directions : A graph showing the price of rice in India during the year 2000 to 2003 is given below. Study the graph carefully and answer the questions.

The month in which the price of rice were equal for the year 2000 and 2001 was
1138 06391d80a58400a550dd8e0a8
6391d80a58400a550dd8e0a8- 1Septemberfalse
- 2Augustfalse
- 3Junetrue
- 4Novemberfalse
- Show AnswerHide Answer
- Workspace
- SingleChoice
Answer : 3. "June "
Q:Directions: The bar graph, given here, shows the number of tickets sold by 6 students A, B, C, D, E and F during a fair.
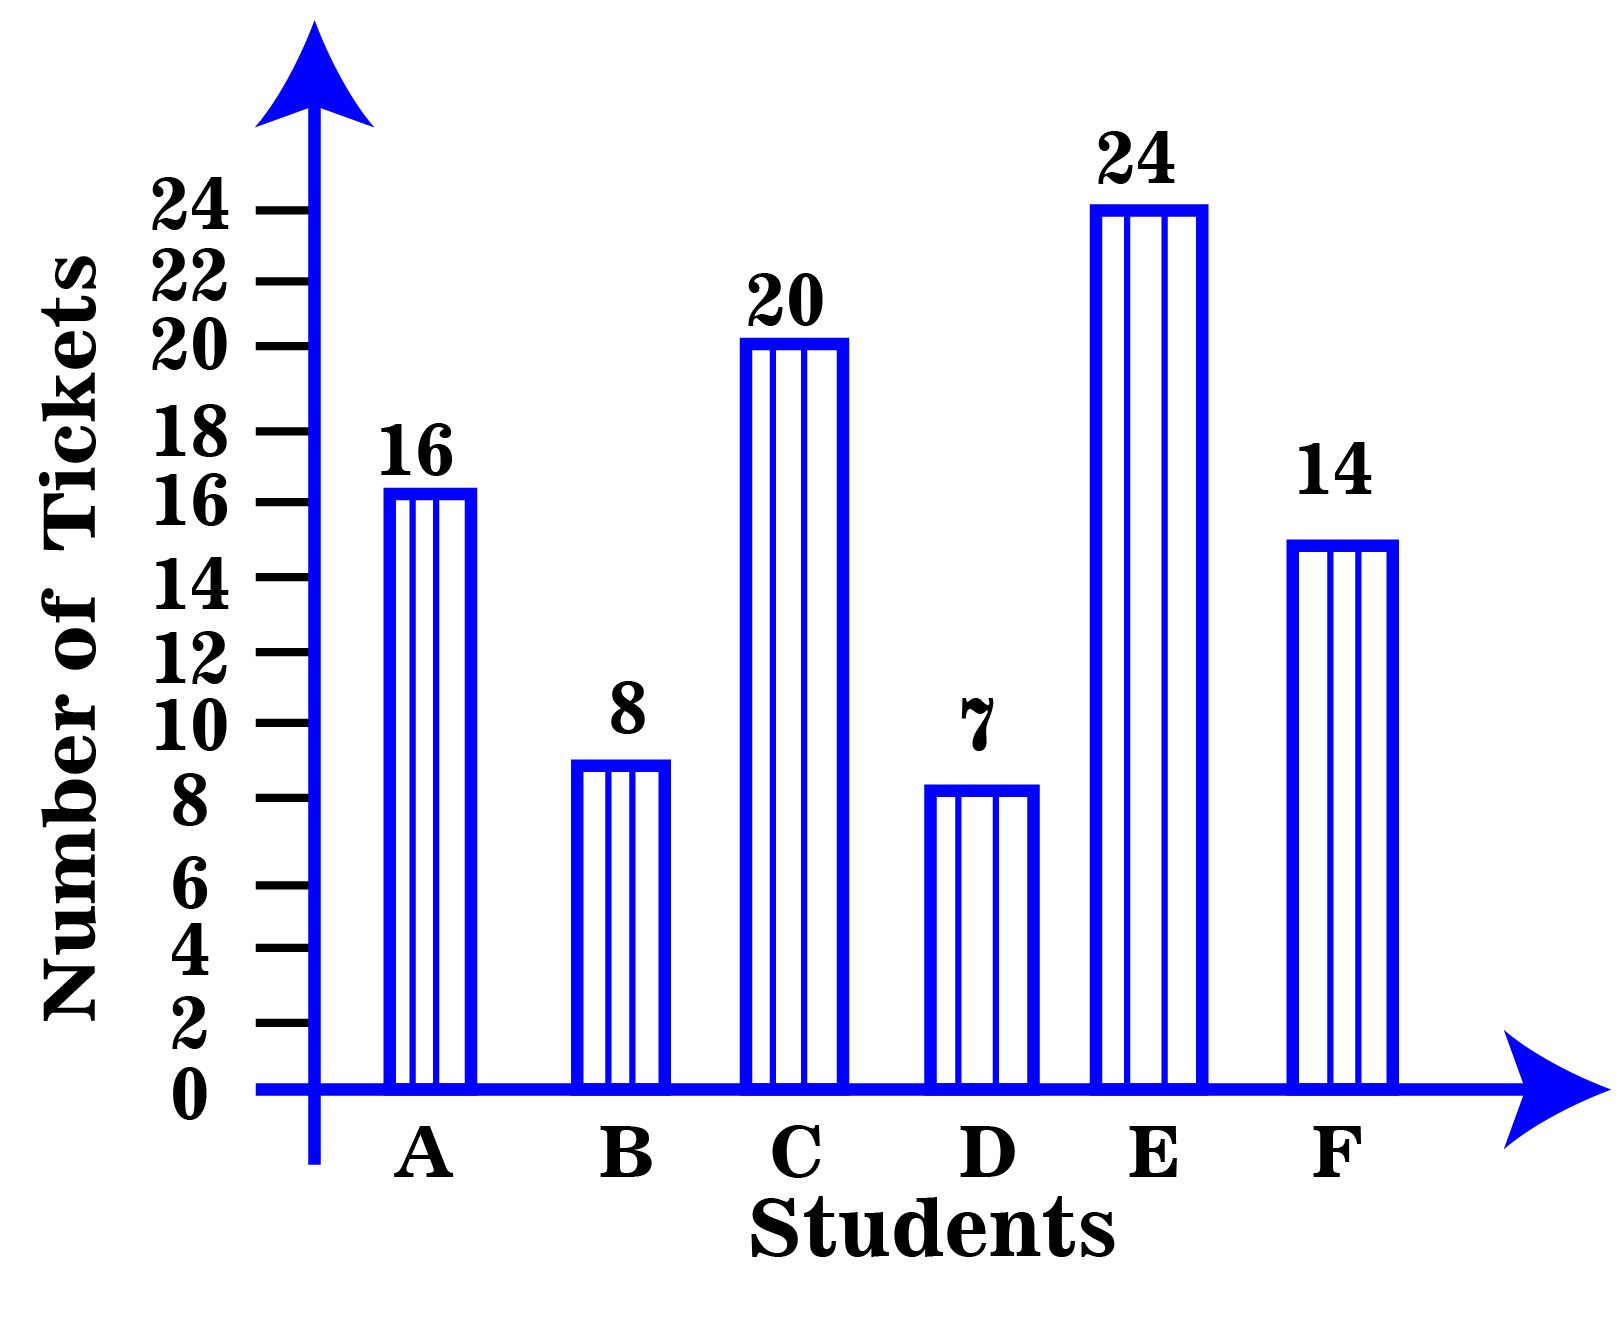
Which student sold the least tickets?
1137 05ea8144c14fb314c31fe88be
5ea8144c14fb314c31fe88be- 1Bfalse
- 2Ffalse
- 3Afalse
- 4Dtrue
- 5None of thesefalse
- Show AnswerHide Answer
- Workspace
- SingleChoice
Answer : 4. "D"
Q:Directions : The graph shows the demand and production of different companies. Study the graph and answer the following questions.
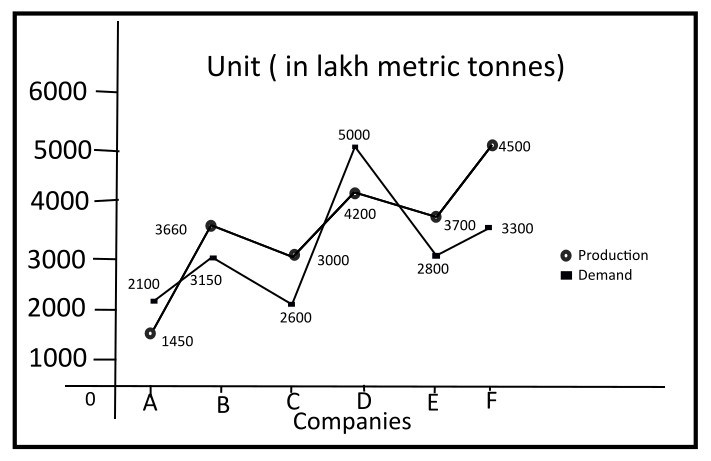
What is the second large demand company?
1137 05f4f730882a7582d892c7ab9
5f4f730882a7582d892c7ab9- 1Ftrue
- 2Bfalse
- 3Afalse
- 4Dfalse
- Show AnswerHide Answer
- Workspace
- SingleChoice