Data Interpretation Questions Practice Question and Answer
8 Q:Study the graph carefully and answer the following questions.
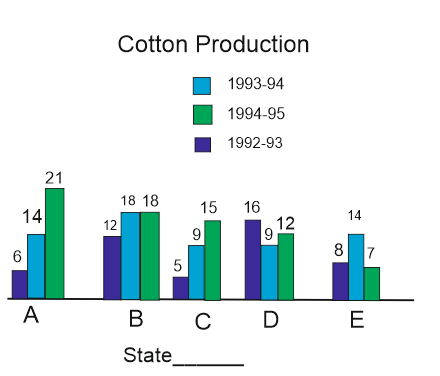
What is the average production of State C for three years?
821 05f15660bcf79540a75340cbf
5f15660bcf79540a75340cbf
- 19.33false
- 29.66true
- 38.33false
- 48.66false
- Show AnswerHide Answer
- Workspace
- SingleChoice
Answer : 2. "9.66"
Q:Directions: The bar graph given below shows the production (in ' 000 tones) of rice of a country for the year 2007 to 2011. Study the graph carefully and answer the question given below it.
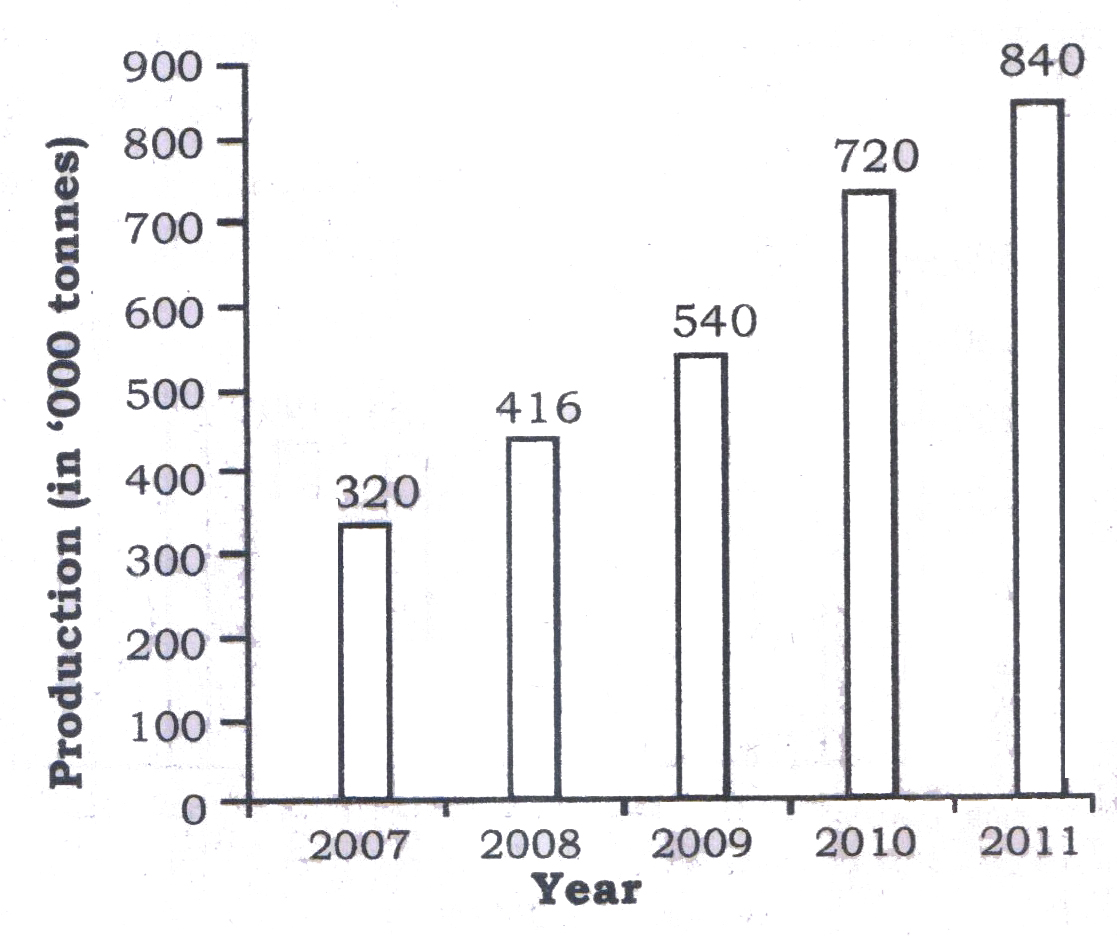
The production of rice in the year 2010 is how much percent more than the production of rice in the year 2009?
819 05e8186dcd56d695255db5657
5e8186dcd56d695255db5657
- 121.5false
- 237.5false
- 342.5false
- 433.33true
- Show AnswerHide Answer
- Workspace
- SingleChoice
Answer : 4. "33.33 "
Q:Directions: The following graph gives Sales, Expense and Capital of a company for a period of five years 1994 to 1998. Read the graph and answer the following questions.
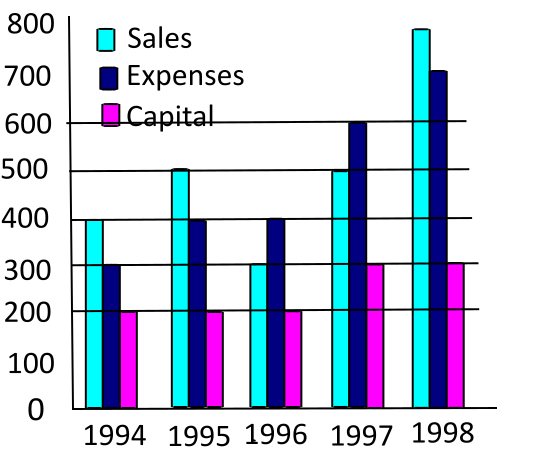
In which year was the Sales to Expense ratio the lowest?
815 05f40e2e89b782961da3f873c
5f40e2e89b782961da3f873c
- 11994false
- 21996true
- 31997false
- 41998false
- Show AnswerHide Answer
- Workspace
- SingleChoice
Answer : 2. "1996"
Q:Directions: The following graph gives Sales, Expense and Capital of a company for a period of five years 1994 to 1998. Read the graph and answer the following questions.

In which year was the ratio of sales to capital the lowest?
813 05f40e6549b782961da3f964a
5f40e6549b782961da3f964a
- 11998false
- 21997false
- 31996true
- 41995false
- Show AnswerHide Answer
- Workspace
- SingleChoice
Answer : 3. "1996"
Q:The following table shows the number of units of product produced and sold by a company during six years.
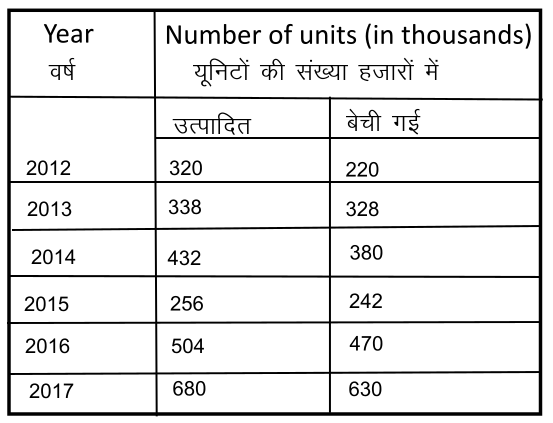
Find the ratio of the total number of units sold in 2013 and 2015 to the number of units sold in 2015 and 2016?
812 05f6d9ac55256e8407c2dd134
5f6d9ac55256e8407c2dd134
- 129 : 38false
- 214 : 19false
- 33 : 4true
- 47 : 9false
- Show AnswerHide Answer
- Workspace
- SingleChoice
Answer : 3. "3 : 4"
Q:Direction: The following graph shows the number of boys and girls in Class V, Class VI, Class VII and Class VIII. Study the graph and answer the question.
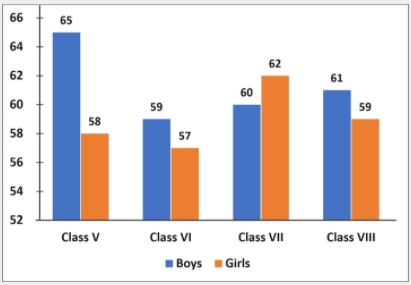
What is the average number of girls in all the classes?
812 0603751ac24cd273bc4f4abfb
603751ac24cd273bc4f4abfb
- 161false
- 259true
- 354false
- 466false
- Show AnswerHide Answer
- Workspace
- SingleChoice
Answer : 2. "59"
Q:The given pie chart shows the percentage of students enrolled for the courses A, B, C, D and E in a university and the table shows the percentage of students that passed, out of the enrolled students.
Total Students=60,000
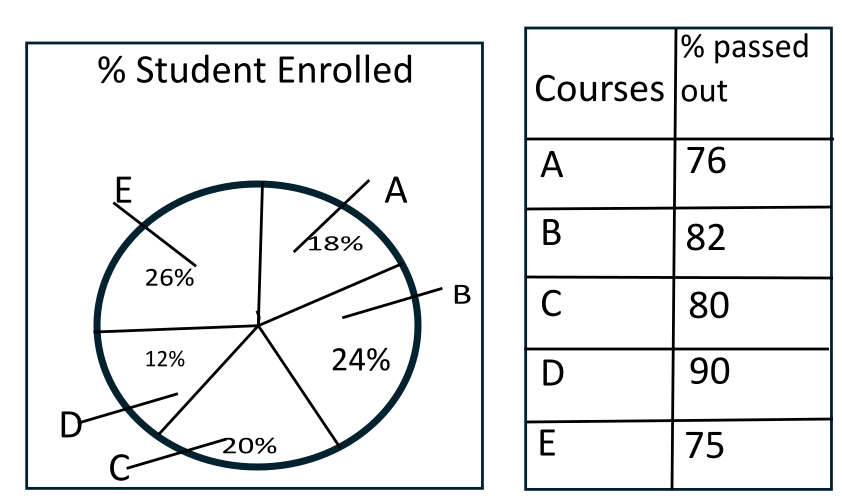
If the total number of students is 60,000, then the total number of students who did not pass in the course A, C is:
810 05ffc34c3b78a0253d6ee6529
5ffc34c3b78a0253d6ee6529Total Students=60,000

- 17628false
- 24992true
- 38253false
- 47852false
- Show AnswerHide Answer
- Workspace
- SingleChoice
Answer : 2. "4992"
Q:The following chart depicts the percentage of Educated and Uneducated men and women in a city with a population of 2,50,000.
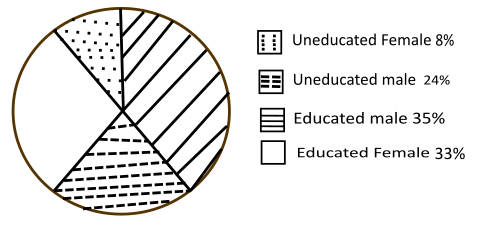
Differentiate between the number of Educated males and Educated females.
810 05f9f9b8cd265227c88cdde25
5f9f9b8cd265227c88cdde25
- 15,000true
- 2500false
- 375,000false
- 41,500false
- Show AnswerHide Answer
- Workspace
- SingleChoice

