Data Interpretation Questions Practice Question and Answer
8 Q:The given pie chart shows the percentage of students enrolled for the courses A, B, C, D and E in a university and the table shows the percentage of students that passed, out of the enrolled students.
Total Students=60,000
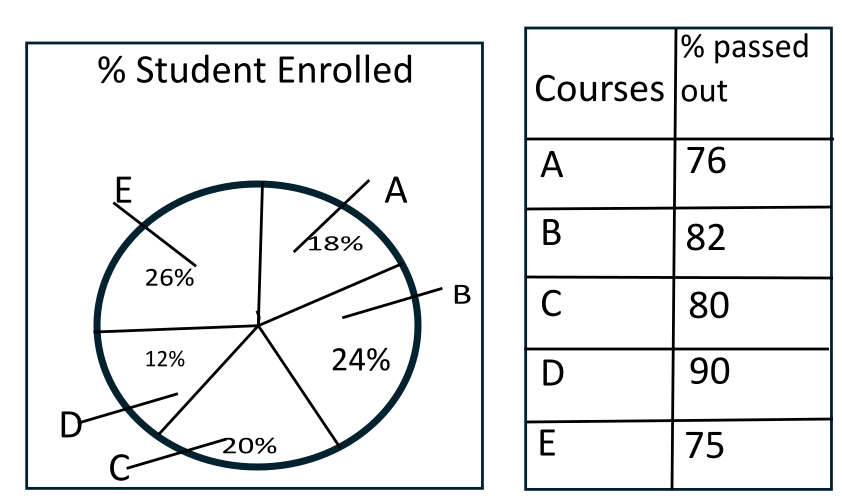
If the total number of students is 60,000, then the total number of students who did not pass in the course A, C is:
1120 05ffc34c3b78a0253d6ee6529
5ffc34c3b78a0253d6ee6529Total Students=60,000
- 17628false
- 24992true
- 38253false
- 47852false
- Show AnswerHide Answer
- Workspace
- SingleChoice
Answer : 2. "4992"
Q:Directions: The following graph gives Sales, Expense and Capital of a company for a period of five years 1994 to 1998. Read the graph and answer the following questions.
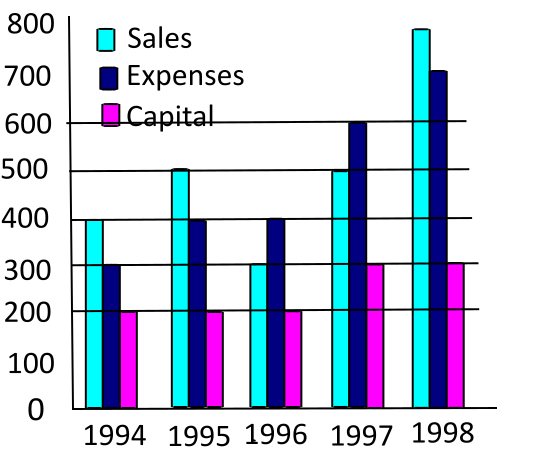
In which year was the Sales to Expense ratio the lowest?
1115 05f40e2e89b782961da3f873c
5f40e2e89b782961da3f873c- 11994false
- 21996true
- 31997false
- 41998false
- Show AnswerHide Answer
- Workspace
- SingleChoice
Answer : 2. "1996"
Q:Directions: The bar graph given below shows the production (in ' 000 tones) of rice of a country for the year 2007 to 2011. Study the graph carefully and answer the question given below it.
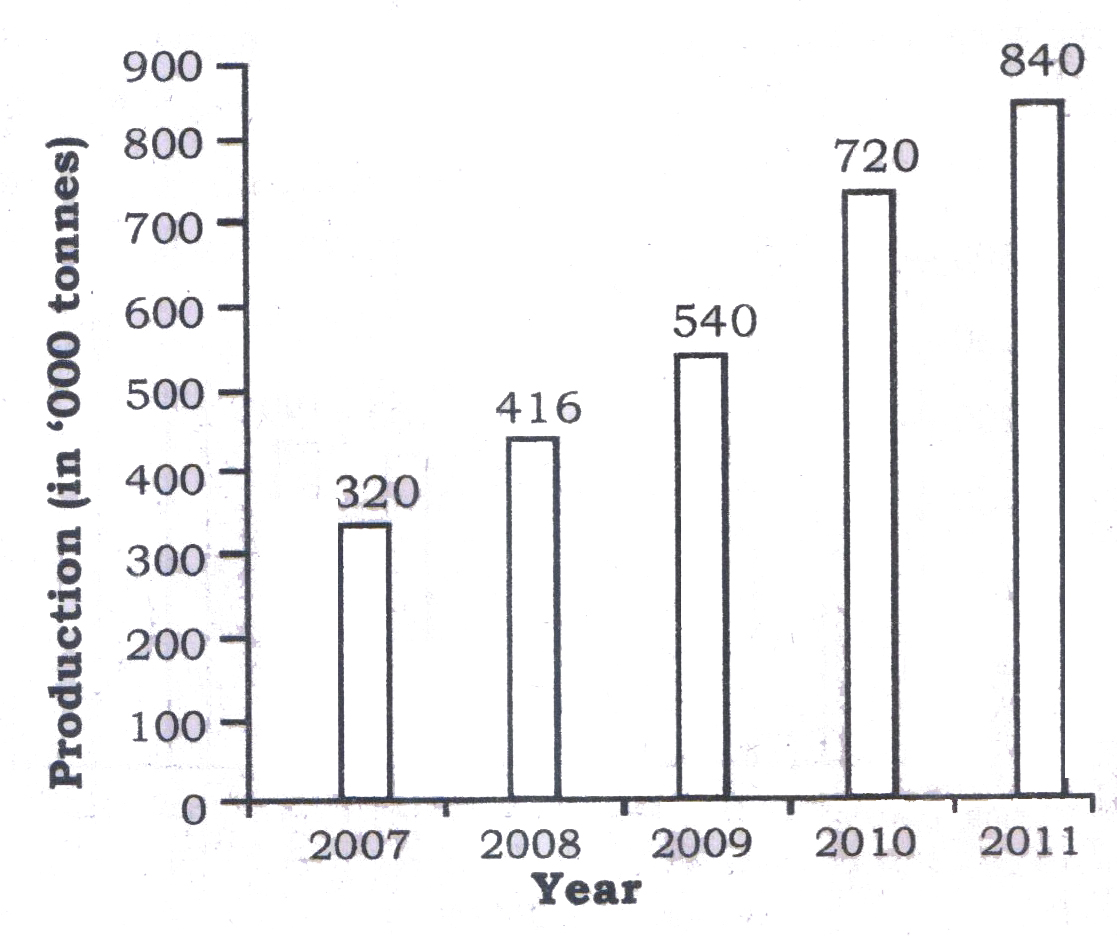
What is the percentage increase in the production of rice in the year 2008 in comparison to the year 2007?
1113 05e8185db4e941d3661dcba05
5e8185db4e941d3661dcba05- 125false
- 230true
- 335false
- 440false
- Show AnswerHide Answer
- Workspace
- SingleChoice
Answer : 2. "30 "
Q:Directions: The following graph gives Sales, Expense and Capital of a company for a period of five years 1994 to 1998. Read the graph and answer the following questions.
In which year was the ratio of sales to capital the lowest?
1112 05f40e6549b782961da3f964a
5f40e6549b782961da3f964a- 11998false
- 21997false
- 31996true
- 41995false
- Show AnswerHide Answer
- Workspace
- SingleChoice
Answer : 3. "1996"
Q:Directions: Study the bar-graph given below & answer the questions.
Pie-chart given below shows the percentage distribution of total no. of boys in six different Schools.
Total Boys in all schools together = 6400
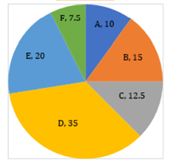
Total student in another school H is 250% more than the boys in school B and ratio of boys to girls in school H is 1 : 2. Then find number of boys in school H?
1111 05e93df499255c93bdf02671c
5e93df499255c93bdf02671cPie-chart given below shows the percentage distribution of total no. of boys in six different Schools.
Total Boys in all schools together = 6400
- 11140false
- 2None of thesefalse
- 31120true
- 41040false
- 51210false
- Show AnswerHide Answer
- Workspace
- SingleChoice
Answer : 3. "1120"
Q:Direction: Study the following information and answer the related questions. P, Q, R, S, T, A, B, C, D and E are employees of a company. A table shows the average age of any two employees of the company. The average age of A and B is 27.5.
i.e. average age of A & P is given as (A+P)/2=39.5
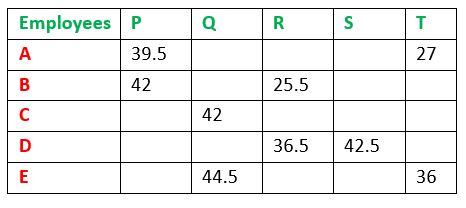
What is the ratio of ages of Q and E?
1108 06062bc2accecc445217a7037
6062bc2accecc445217a7037i.e. average age of A & P is given as (A+P)/2=39.5
- 123: 25false
- 225: 23false
- 346: 43true
- 443: 46false
- 5None of thesefalse
- Show AnswerHide Answer
- Workspace
- SingleChoice
Answer : 3. "46: 43 "
Q:The line graph shows the number of vacancies of accountants in a certain company. Study the diagram and answer the following questions.
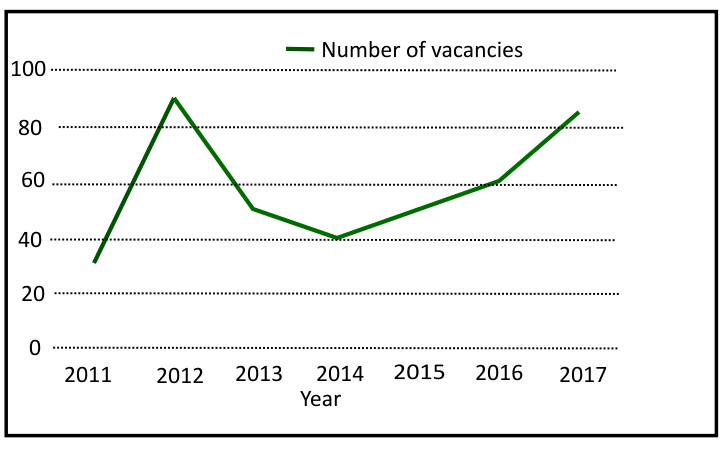
Between which two years is the rate of decrement in vacancies is maximum?
1108 05f5b079c69ed13038c1a6f39
5f5b079c69ed13038c1a6f39- 12013-2014false
- 22012-2015false
- 32012-2014false
- 42012-2013true
- Show AnswerHide Answer
- Workspace
- SingleChoice
Answer : 4. "2012-2013"
Q:Directions: Study the bar-graph given below & answer the questions.
Pie-chart given below shows the percentage distribution of total no. of boys in six different Schools.
Total Boys in all schools together = 6400
If ratio of girls to total students in school E is 3 : 5. Then find difference of boys in school D to girls in school E?
1107 05e93decc1ca91a3c02dd540b
5e93decc1ca91a3c02dd540bPie-chart given below shows the percentage distribution of total no. of boys in six different Schools.
Total Boys in all schools together = 6400
- 1460false
- 2420false
- 3None of thesefalse
- 4360false
- 5320true
- Show AnswerHide Answer
- Workspace
- SingleChoice