Data Interpretation Questions Practice Question and Answer
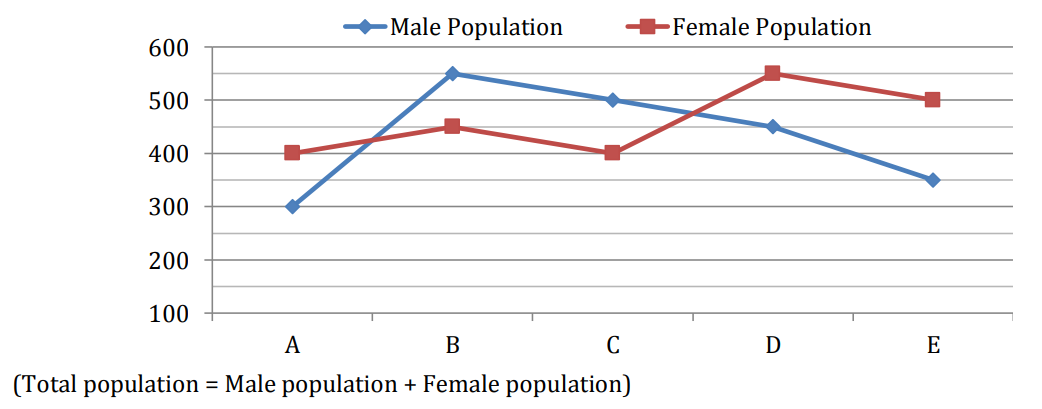
8 Q:Directions : Given line graph shows the data of male & female population in 5 different cities. Read the data carefully and answer the questions.

By what percent total population of city A is more or less than that of city D?
1367 060408744e759ac364c93e39d
60408744e759ac364c93e39d
- 145%false
- 235%false
- 370%false
- 430%true
- 560%false
- Show AnswerHide Answer
- Workspace
- SingleChoice
Answer : 4. "30%"
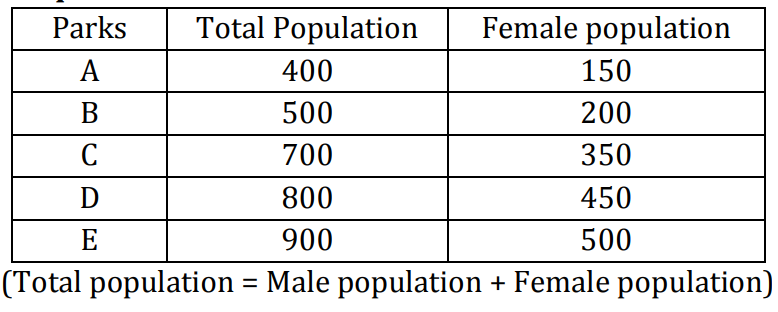
Q:Directions: Given table shows the data of population in 5 different parks. Study the data carefully and answer the questions.

What is ratio of male population in park A & D together to female population in park B & E together?
1310 0603f61cc0634b252a6b662db
603f61cc0634b252a6b662db
- 16 ∶ 7true
- 21 ∶ 1false
- 37 ∶ 6false
- 45 ∶ 6false
- 55 ∶ 7false
- Show AnswerHide Answer
- Workspace
- SingleChoice
Answer : 1. "6 ∶ 7"
Q:Directions: Given table shows the data of population in 5 different parks. Study the data carefully and answer the questions.

By what percent female population in park D is more or less than the male population in park E?
1366 0603f617ee759ac364c9104bf
603f617ee759ac364c9104bf
- 115%false
- 29.09%false
- 311.11%false
- 414.28%false
- 512.5%true
- Show AnswerHide Answer
- Workspace
- SingleChoice
Answer : 5. "12.5%"
Q:Directions: Given table shows the data of population in 5 different parks. Study the data carefully and answer the questions.

What is average of male population in park B, C and D?
1988 0603f604e56eac5533a8f3af2
603f604e56eac5533a8f3af2
- 1343.33false
- 2313.33false
- 3323.33false
- 4333.33true
- 5353.33false
- Show AnswerHide Answer
- Workspace
- SingleChoice
Answer : 4. "333.33"
Q:Directions: Given table shows the data of population in 5 different parks. Study the data carefully and answer the questions.

If 20% of total population did not visit on a particular day in park A of which male population was 60% then what percent of total population in park B is male population who visited in park A?
3765 0603f5f4856eac5533a8f3797
603f5f4856eac5533a8f3797
- 145%false
- 240.4%true
- 339.2%false
- 448.6%false
- 5None of thesefalse
- Show AnswerHide Answer
- Workspace
- SingleChoice
Answer : 2. "40.4%"
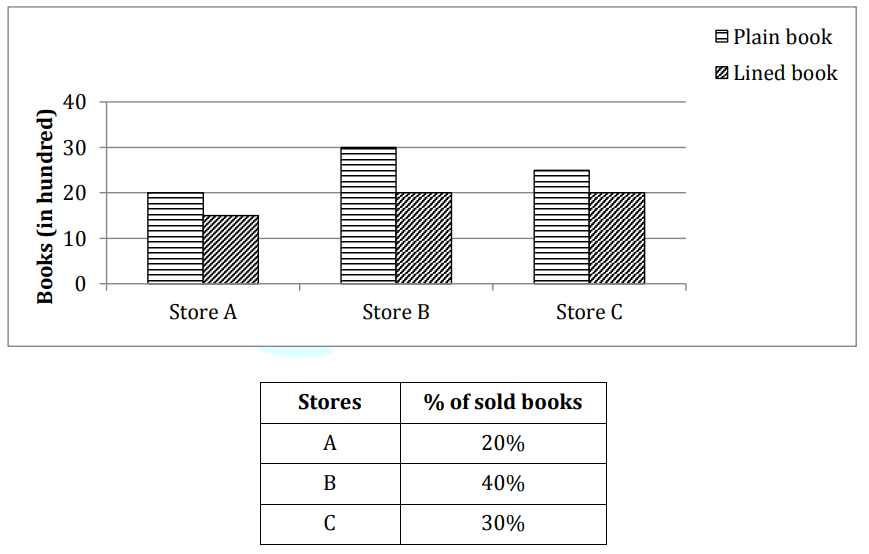
Q:Direction: Given bar graph shows the number of plain books and lined books (in hundreds) available at three different stores and the table shows the percentage of total books (Plain + lined) that was sold by different stores.

The selling price of each plain books and lined books sold by store B is Rs. 250 and Rs. 175 respectively. Then, find the total amount earned by store B on selling these books if 60% of lined books are sold by the store?
2492 0603f4343e759ac364c904dfa
603f4343e759ac364c904dfa
- 1₹ 3.8 lacfalse
- 2₹ 4.1 lactrue
- 3₹ 2.5 lacfalse
- 4₹ 3.6 lacfalse
- 5₹ 3.5 lacfalse
- Show AnswerHide Answer
- Workspace
- SingleChoice
Answer : 2. "₹ 4.1 lac"
Q:Direction: Given bar graph shows the number of plain books and lined books (in hundreds) available at three different stores and the table shows the percentage of total books (Plain + lined) that was sold by different stores.

Unsold books of store A is approximately is what percent more or less than total unsold books of store B and C together.
1714 0603f3cefe759ac364c902aee
603f3cefe759ac364c902aee
- 159%false
- 252%false
- 348%false
- 454%true
- 557%false
- Show AnswerHide Answer
- Workspace
- SingleChoice
Answer : 4. "54% "
Q:Direction: Given bar graph shows the number of plain books and lined books (in hundreds) available at three different stores and the table shows the percentage of total books (Plain + lined) that was sold by different stores.

The ratio of sold plain and lined books for store C is 5 : 4 and for store B is 3 : 2. Then find the total plain books sold by these two stores together?
1602 0603f3c5f251bf6540042e08d
603f3c5f251bf6540042e08d
- 11950true
- 21975false
- 31750false
- 41825false
- 51850false
- Show AnswerHide Answer
- Workspace
- SingleChoice

