Data Interpretation Questions Practice Question and Answer
8 Q:Study the following graph carefully to answer the given questions
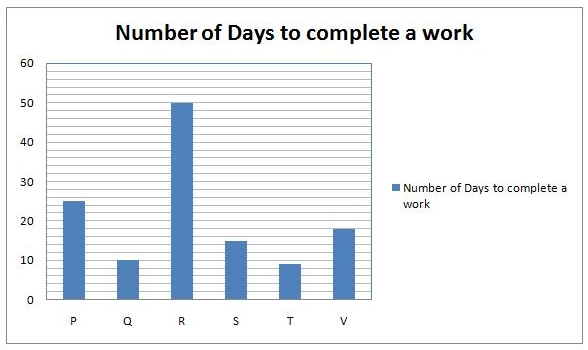
The efficiency of L is 25% more than P. L started a work alone and then P joined her 5 days before actual completion of the work. For how many days L worked alone?
918 05ea9405b07542b13ae2c1662
5ea9405b07542b13ae2c1662- 19false
- 211true
- 310false
- 425false
- 512false
- Show Answer
- Workspace
- SingleChoice
Answer : 2. "11"
Q:Directions: Following is the pie-chart showing the spending of a family on various items in a particular year
Study the pie chart and answer questions
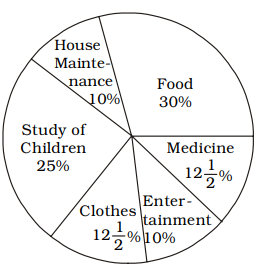
If the difference in the amount spent for buying clothes and house maintenance was ₹ 1,500, how much they spent for house maintenance?
916 063be706261d62119f1dbc6fa
63be706261d62119f1dbc6fa- 1₹ 5,000false
- 2₹ 6,000true
- 3₹ 7,000false
- 4₹ 8,000false
- Show Answer
- Workspace
- SingleChoice
Answer : 2. "₹ 6,000 "
Q:The following table shows the number of units of product produced and sold by a company during six years.
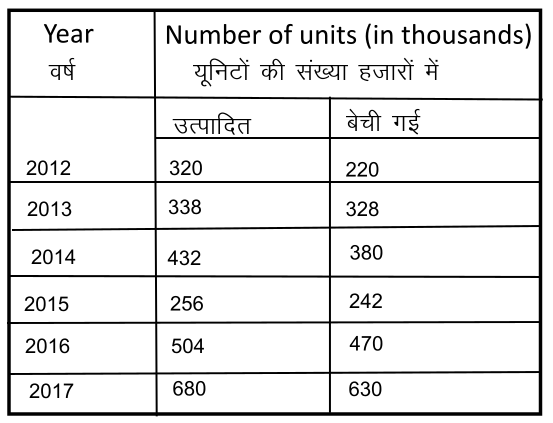
Find the ratio of the total number of units sold in 2013 and 2015 to the number of units sold in 2015 and 2016?
916 05f6d9ac55256e8407c2dd134
5f6d9ac55256e8407c2dd134- 129 : 38false
- 214 : 19false
- 33 : 4true
- 47 : 9false
- Show Answer
- Workspace
- SingleChoice
Answer : 3. "3 : 4"
Q:Directions: Study the bar-graph given below & answer the questions.
Pie-chart given below shows the percentage distribution of total no. of boys in six different Schools.
Total Boys in all schools together = 6400
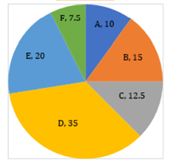
If ratio of girls to total students in school E is 3 : 5. Then find difference of boys in school D to girls in school E?
915 05e93decc1ca91a3c02dd540b
5e93decc1ca91a3c02dd540bPie-chart given below shows the percentage distribution of total no. of boys in six different Schools.
Total Boys in all schools together = 6400
- 1460false
- 2420false
- 3None of thesefalse
- 4360false
- 5320true
- Show Answer
- Workspace
- SingleChoice
Answer : 5. "320"
Q:Study the following table carefully and answer the questions given below.
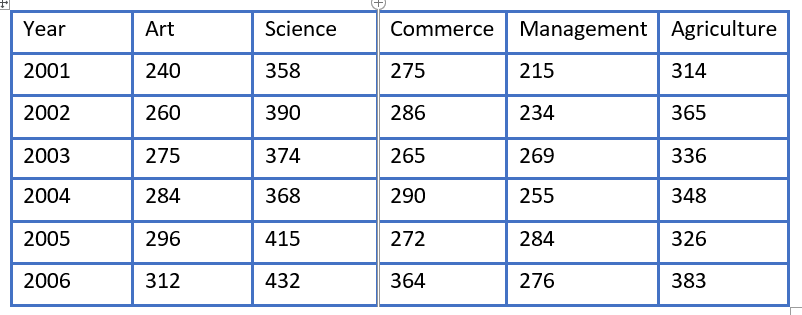
In which discipline was there a continuous increase in number of students over the given years?
915 05da0507000e22578c9e9910f
5da0507000e22578c9e9910f- 1Sciencefalse
- 2Agriculturefalse
- 3Artstrue
- 4Commercefalse
- 5managementfalse
- Show Answer
- Workspace
- SingleChoice
Answer : 3. "Arts"
Q:The given pie chart shows the percentage of students enrolled for the courses A, B, C, D and E in a university and the table shows the percentage of students that passed, out of the enrolled students.
Total Students=60,000
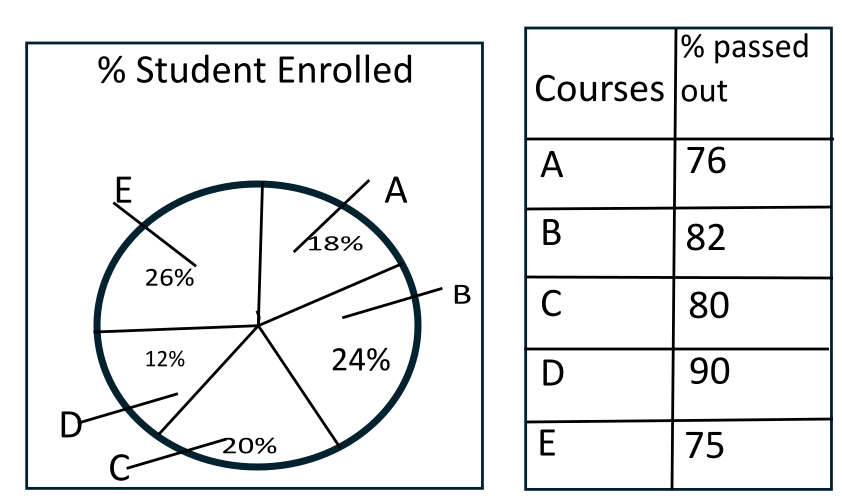
How many students passed in Course B?
915 05ffc353523210f22f330372a
5ffc353523210f22f330372aTotal Students=60,000
- 12512false
- 22490true
- 32392false
- 42592false
- Show Answer
- Workspace
- SingleChoice
Answer : 2. "2490"
Q:The table given below shows the information about bats manufactured by 6 different companies. Each company manufactures only plastic and wooden bats. Each company labels these bats as Brand A or Brand B. The table shows the number of plastic bats as a percentage of total bats manufactured by each company. It also shows the ratio of wooden bats labelled A and B. Each company manufactured a total 550000 bats.

N= wooden bats of brand B manufactured by U.
M= Total wooden bats manufactured by R and W together.
What is the value of N/M?
914 05f30d792bcbb69394d1c9def
5f30d792bcbb69394d1c9defM= Total wooden bats manufactured by R and W together.
What is the value of N/M?
- 10.043false
- 20.061true
- 30.125false
- 40.087false
- Show Answer
- Workspace
- SingleChoice
Answer : 2. "0.061"
Q:Directions: Study the following table carefully to answer the questions that follow .
Number of soldiers ( in thousands ) joining five different forces during six different.
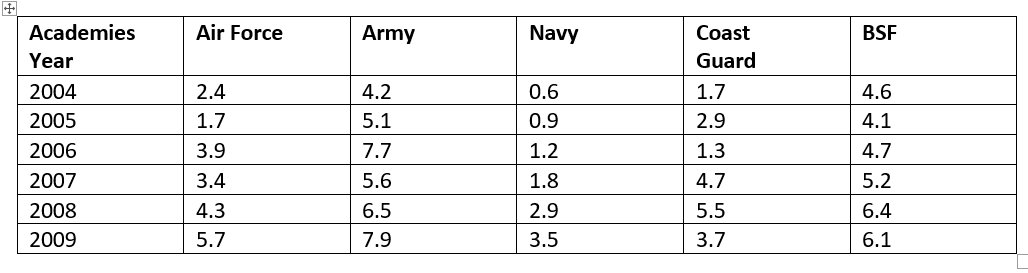
What was the average number of soldiers joining all the forces together in the year 2007?
913 05e82ebabd06376635697510a
5e82ebabd06376635697510aNumber of soldiers ( in thousands ) joining five different forces during six different.
- 14,620false
- 242,400false
- 34,260false
- 442,600false
- 5None of thesetrue
- Show Answer
- Workspace
- SingleChoice