Data Interpretation Questions Practice Question and Answer
8 Q:Direction: The line chart given below shows the number of labors (men and women) working in six different years. Study the data carefully and answer the following questions.
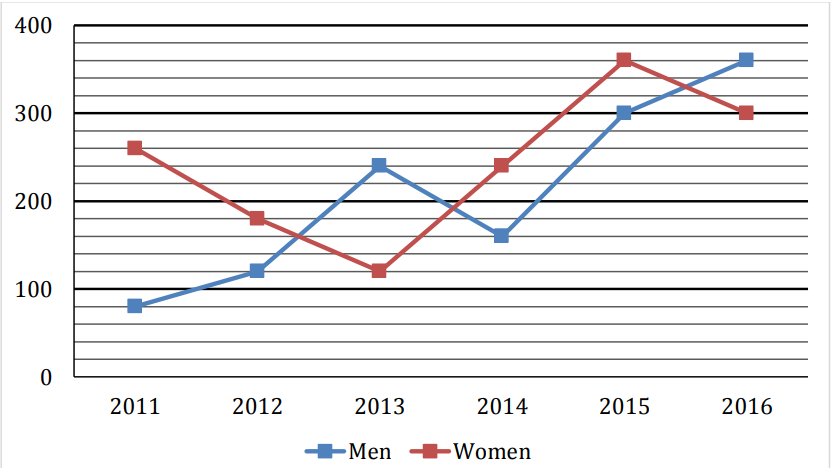
Number of Men working in 2017 is 15% more than that of 2015 while number of Women working in 2017 is 40% less than that of 2014. Find total number of labors (Men + Women) working in 2017?
2377 0603dc76d6f990444b4a3ed31
603dc76d6f990444b4a3ed31
- 1594false
- 2630false
- 3561false
- 4456false
- 5489true
- Show Answer
- Workspace
- SingleChoice
Answer : 5. "489 "
Q:Study the following graph to answer these questions :
Percent profit earned by two companies A & B over the years.
Profit = Income – Expenditure
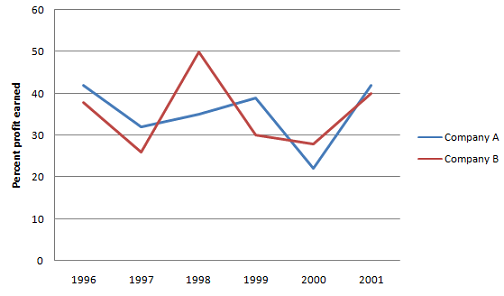
Expenditure of Company B in years 1996 and 1997 were in the ratio of 5:7 respectively. What was the respective ratio of their incomes?
2361 05e79abcb8560ba13b027618f
5e79abcb8560ba13b027618fPercent profit earned by two companies A & B over the years.
Profit = Income – Expenditure

- 110:13false
- 28:13false
- 313:14false
- 411:14false
- 5None of thesetrue
- Show Answer
- Workspace
- SingleChoice
Answer : 5. "None of these"
Q:Study the following graph to answer these questions :
Percent profit earned by two companies A & B over the years.
Profit = Income – Expenditure

If the expenditure of Company A in 1997 was Rs.70 lakhs and income of Company A in 1997 was equal to its expenditure in 1998, what was the total income (in Rs. lakh) of the Company A in 1997 & 1998 together?
2352 05e79ab3f8560ba13b0276082
5e79ab3f8560ba13b0276082Percent profit earned by two companies A & B over the years.
Profit = Income – Expenditure

- 1175false
- 2131.25false
- 3218.75true
- 4Cannot be determinedfalse
- 5None of thesefalse
- Show Answer
- Workspace
- SingleChoice
Answer : 3. "218.75"
Q:Directions:Study the following table carefully to answer these questions:
Percentage of Marks obtained by six students in six subjects

What is the ratio between total marks obtained by D in Biology, Maths and English together and the total marks obtained by F in these subjects together respectively?
2288 05e78a38050339c73666150d6
5e78a38050339c73666150d6
- 1209 : 215true
- 2215 : 209false
- 3206 : 223false
- 4223 : 206false
- 5None of thesefalse
- Show Answer
- Workspace
- SingleChoice
Answer : 1. "209 : 215 "
Q:Direction : Given here is a multiple bar diagram of the scores of four players in two innings. Study the diagram and answer the questions.
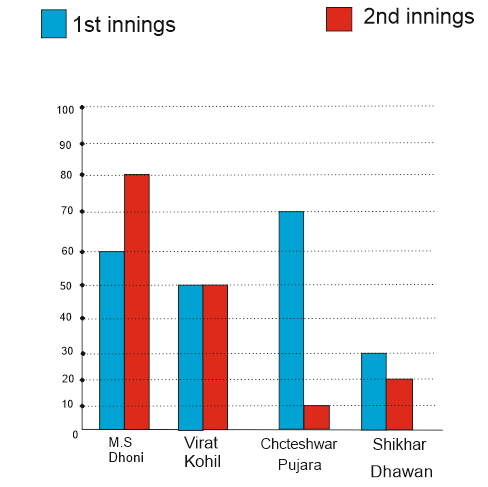
The average score in second innings contributed by the four players is:
2226 05da82e168f123a0cca934cff
5da82e168f123a0cca934cff
- 140true
- 250false
- 330false
- 460false
- Show Answer
- Workspace
- SingleChoice
Answer : 1. "40"
Q:Study the following graph to answer these questions :
Percent profit earned by two companies A & B over the years.
Profit = Income – Expenditure

If the income of Company A in 1998 was Rs. 1,42,500 what was its expenditure in that year?
2226 05e79aa214572817353d624e6
5e79aa214572817353d624e6Percent profit earned by two companies A & B over the years.
Profit = Income – Expenditure

- 1RS. 1,05,000false
- 2RS. 95,500false
- 3RS. 99,500false
- 4RS. 1,05,555false
- 5None of thesetrue
- Show Answer
- Workspace
- SingleChoice
Answer : 5. "None of these "
Q:Direction (94-98): Study the following table to answer the given questions.
Centre and Post-wise Numbered of candidate
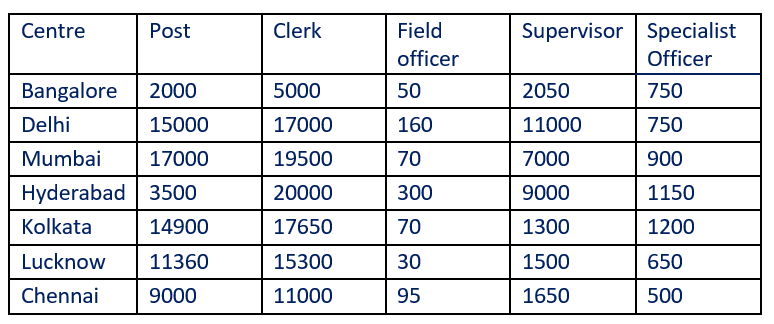
In Kolkata, number of Specialist Officers is approximately what percent of that of Officers?
2218 05da4033ffac0ed7fa90c3844
5da4033ffac0ed7fa90c3844Centre and Post-wise Numbered of candidate

- 18.7false
- 29false
- 36.5false
- 48true
- 56.9false
- Show Answer
- Workspace
- SingleChoice
Answer : 4. "8"
Q:Direction: Given bar graph shows the number of plain books and lined books (in hundreds) available at three different stores and the table shows the percentage of total books (Plain + lined) that was sold by different stores.
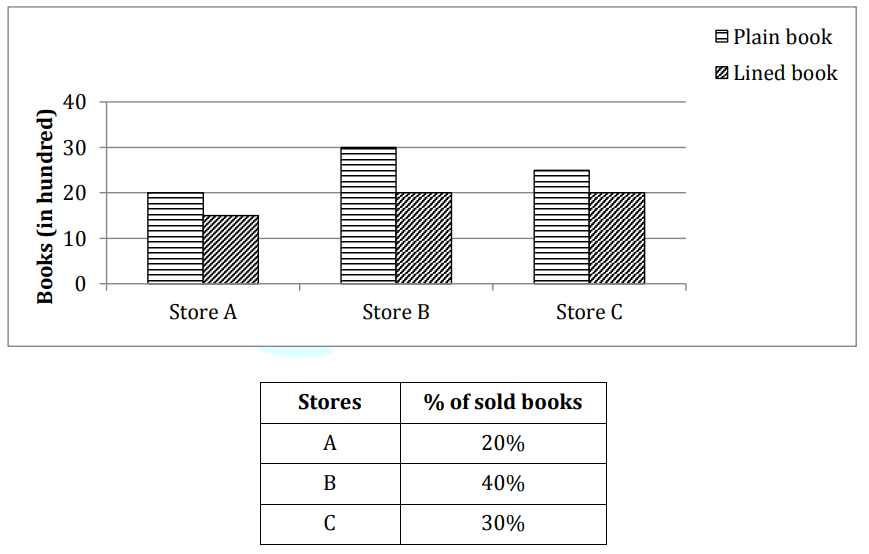
The selling price of each plain books and lined books sold by store B is Rs. 250 and Rs. 175 respectively. Then, find the total amount earned by store B on selling these books if 60% of lined books are sold by the store?
2181 0603f4343e759ac364c904dfa
603f4343e759ac364c904dfa
- 1₹ 3.8 lacfalse
- 2₹ 4.1 lactrue
- 3₹ 2.5 lacfalse
- 4₹ 3.6 lacfalse
- 5₹ 3.5 lacfalse
- Show Answer
- Workspace
- SingleChoice

