Data Interpretation Questions Practice Question and Answer
8 Q:Direction: Read the following table carefully and answer the following questions: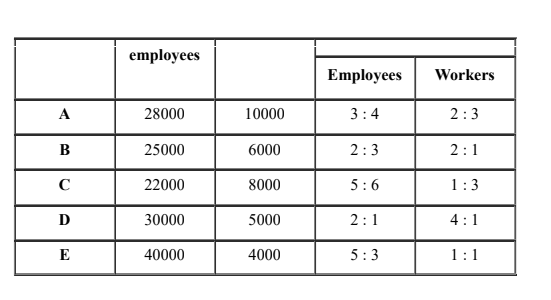
Find the average male employees of five companies.
413 064d4e32aebd5c3747278ec73
64d4e32aebd5c3747278ec73- 115600false
- 216400false
- 315400true
- 416600false
- 514400false
- Show Answer
- Workspace
- SingleChoice
Answer : 3. "15400"
Q:Directions : Read the graph and answer the following questions.
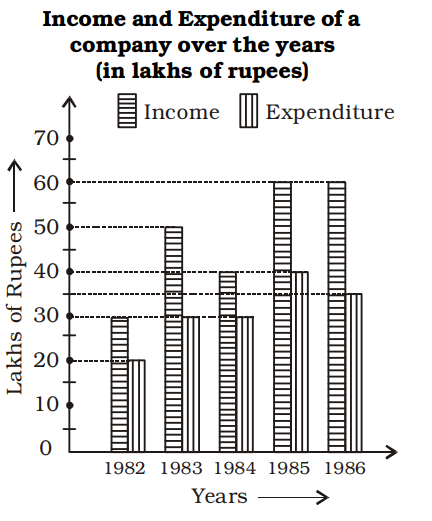
The total income exceeds the total expenditure over the years1982 to 1986 by
400 064610542f75f230a7a71f3b1
64610542f75f230a7a71f3b1- 185 lakhstrue
- 2105 lakhsfalse
- 3115 lakhsfalse
- 4120 lakhsfalse
- Show Answer
- Workspace
- SingleChoice
Answer : 1. "85 lakhs "
Q:Direction: Read the following table carefully and answer the following questions:
Find the difference between the female employees of company D and female workers of the same company.
400 064d4e42180ef1e74b4d4105b
64d4e42180ef1e74b4d4105b- 18000false
- 27000false
- 310000false
- 49000false
- 512000true
- Show Answer
- Workspace
- SingleChoice
Answer : 5. "12000"
Q:Directions: Study the following information carefully and answer the questions given below.
In the table, the percentage of shirts (formal and casual) sold out of the total number of shirts sold in the week and the number of casual shirts sold data related to the number of shirts sold on ve weekdays – Monday, Tuesday, Wednesday, Thursday and Friday are given.
Total number of shirts sold in the week = x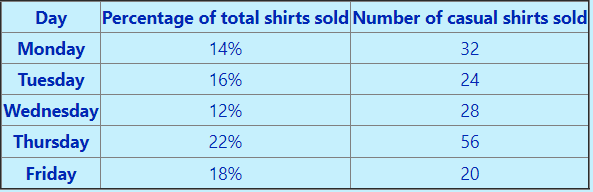 Note: Total number of shirts sold on Saturday and Sunday together = 72
40% of casual shirts sold and 25% of formal shirts sold on Friday of brand X, then the number of shirts sold of brands other than X on Friday is
394 064e5ef003be218b6cdc29ab1
64e5ef003be218b6cdc29ab1In the table, the percentage of shirts (formal and casual) sold out of the total number of shirts sold in the week and the number of casual shirts sold data related to the number of shirts sold on ve weekdays – Monday, Tuesday, Wednesday, Thursday and Friday are given.
Note: Total number of shirts sold on Saturday and Sunday together = 72- 121false
- 231false
- 341false
- 451true
- 5None of thesefalse
- Show Answer
- Workspace
- SingleChoice
Answer : 4. "51"
Q:Directions : The bar graph, given here, shows the demand and production of colour televisions of five companies for Diwali season in the year 2009. Study the graph carefully and answer the questions based on the graph.
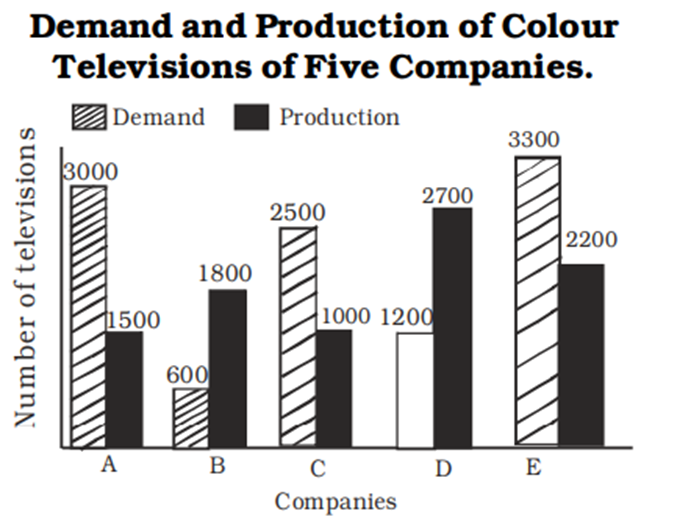
The ratio of the demand and production of colour televisions of company E is :
392 06460f911f75f230a7a71eb22
6460f911f75f230a7a71eb22- 13 : 2true
- 22 : 3false
- 32 : 1false
- 41 : 2false
- Show Answer
- Workspace
- SingleChoice
Answer : 1. "3 : 2 "
Q:Directions: Degree- wise breakup of employees working in various department of an organisation and the ratio to men to women.
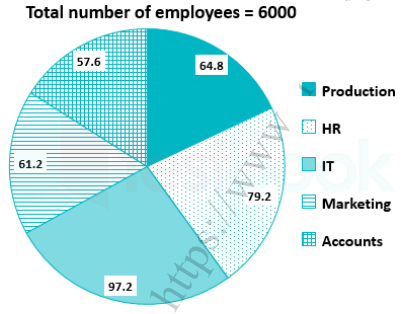
Respective ratio of men to women in each department
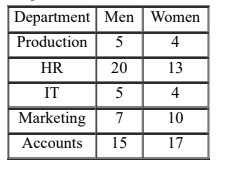
The number of women working in the Production department of the Organisation is what percent of the total number of employees working in all the department together?
391 064da0440ebd5c374728ae566
64da0440ebd5c374728ae566- 14%false
- 26%false
- 35%false
- 47%false
- 58%true
- Show Answer
- Workspace
- SingleChoice
Answer : 5. "8%"
Q:Direction: The line chart given below shows number of labourers (men and women) working in six different years. Study the data carefully and answer the following questions.
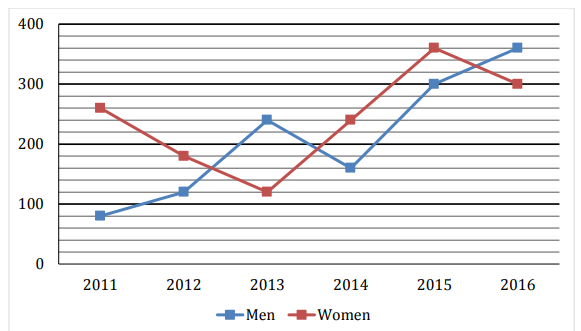
The number of Men working in 2017 is 15% more than that of 2015 while the number of Women working in 2017 is 40% less than that of 2014. Find the total number of labourers (Men + Women) working in 2017.
390 064d4b3979ce88dacc34344f7
64d4b3979ce88dacc34344f7- 1561false
- 2456false
- 3489true
- 4594false
- 5630false
- Show Answer
- Workspace
- SingleChoice
Answer : 3. "489"
Q:Directions : Given here is a pie chart showing the cost of gold in 2010, 2011, 2012 and 2013. Study the chart and answer the following questions
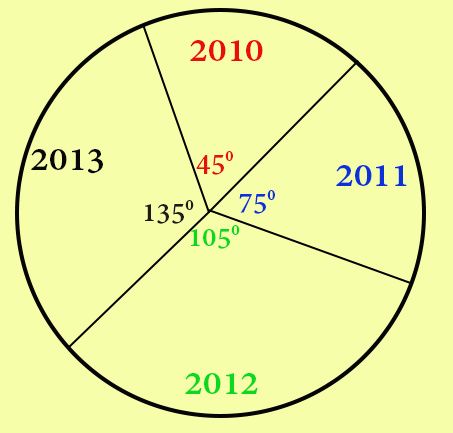
The ratio of percentage increases in price of gold from 2011 to 2012 and 2012 to 2013 is
385 064539f4739143d085f3e3c04
64539f4739143d085f3e3c04- 16 : 5false
- 27 : 5true
- 38 : 5false
- 49 : 5false
- Show Answer
- Workspace
- SingleChoice