Data Interpretation Questions Practice Question and Answer
8 Q:Directions: Read the pie chart carefully and answer the following questions.
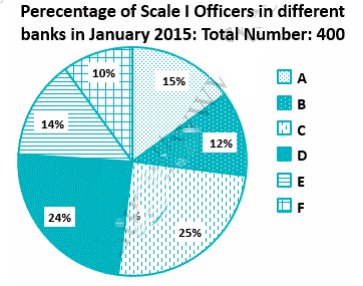
Note: No new employees joined the given banks of left the given banks from January 2015 to December 2015.
In January 2015, 32% of the total number of scale I officers in Banks B, D, and E together were unmarried. If the respective ratio between the number of unmarried officers in these banks was 3 : 2 : 3, what was the number of unmarried Scale I officers in Bank D?
423 064f1df442bbb242750de1fca
64f1df442bbb242750de1fca- 118false
- 224false
- 314false
- 420true
- 516true
- Show Answer
- Workspace
- SingleChoice
Answer : 4. "20" 5. "16"
Q:Directions : The Bar Graph given here shows the population (in crores) of India in various census years. Observe the graph and answer the question based on it.
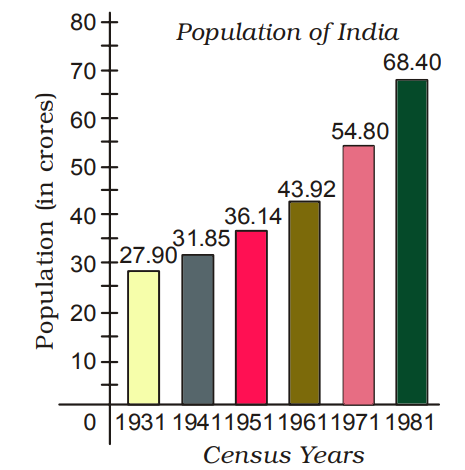
In which census year, the per cent increase in population is highest as compared to that in the previous census year?
423 06453a943613f9f6e3315cfe5
6453a943613f9f6e3315cfe5- 11951false
- 21961false
- 31971false
- 41981true
- Show Answer
- Workspace
- SingleChoice
Answer : 4. "1981 "
Q:Directions: Degree- wise breakup of employees working in various department of an organisation and the ratio to men to women.
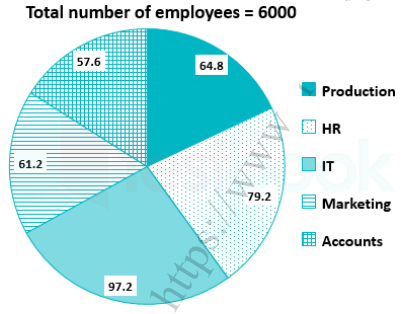
Respective ratio of men to women in each department
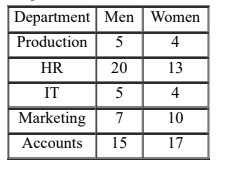
The number of men working in the IT department of the Organisation is approximately what percent of the total number of employees working in that department?
422 064da039fe0ce5574969ee2ab
64da039fe0ce5574969ee2ab- 124%false
- 256%true
- 340%false
- 472%false
- 550%false
- Show Answer
- Workspace
- SingleChoice
Answer : 2. "56%"
Q:Directions: Student’s strength of a college in Arts, Science and Commerce from 2004-05 to 2007- 08 sessions are shown in the following bar graph. Study the graph and answer the questions
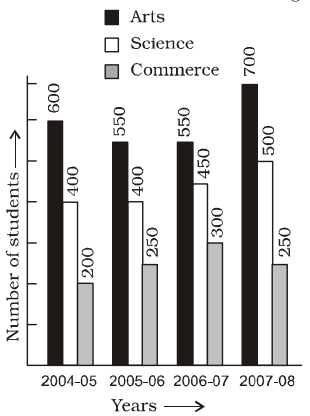
The % increase in science students in 2007-08 over 2006-07 was
422 063f35cc00fa4111f87f087c0
63f35cc00fa4111f87f087c0- 110.1%false
- 211.1%true
- 316.7%false
- 418.2%false
- Show Answer
- Workspace
- SingleChoice
Answer : 2. "11.1% "
Q:Directions : Study the following bar graph and answer the questions.
company (in lakhs of rupees) for the years 1994-1997:
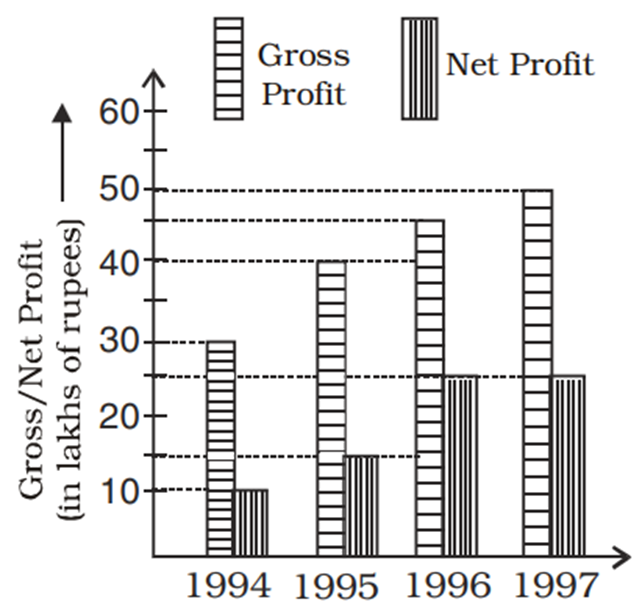
The ratio of gross profit to net profit in a year was greatest in the year
419 06460f638cdae930acb746048
6460f638cdae930acb746048- 11994true
- 21995false
- 31996false
- 41997false
- Show Answer
- Workspace
- SingleChoice
Answer : 1. "1994 "
Q:Direction: Study the following line graph carefully and answer the questions given below.
In the below line graph, the number of animals in two zoo A and B in the years – 2001, 2003, 2005 and 2007 is given.
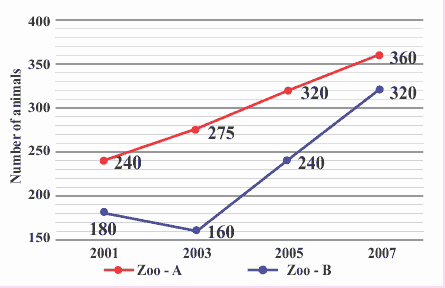
If in the year 2005, 35% of animals in zoo-A and 55% of animals in zoo-B are carnivorous, then what is the sum of the number of carnivorous animals in zoo A and B in the years 2005?
417 064e5db5fd928d8b7160df4b6
64e5db5fd928d8b7160df4b6In the below line graph, the number of animals in two zoo A and B in the years – 2001, 2003, 2005 and 2007 is given.
- 1184false
- 2196false
- 3222false
- 4244true
- 5None of thesefalse
- Show Answer
- Workspace
- SingleChoice
Answer : 4. "244"
Q:Direction: The line chart given below shows number of labourers (men and women) working in six different years. Study the data carefully and answer the following questions.
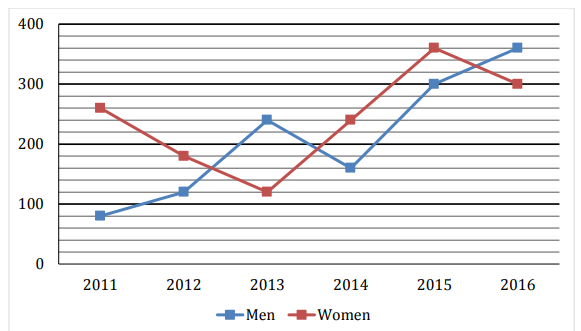
The total number of Men working in all six years is how much more/less than total number of Women working in all six years together?
414 064d4b5b8d02c5c746bdc504a
64d4b5b8d02c5c746bdc504a- 1140false
- 2160false
- 3180false
- 4200true
- 5None of the given optionsfalse
- Show Answer
- Workspace
- SingleChoice
Answer : 4. "200"
Q:Directions : Study the following graph and answer the questions.
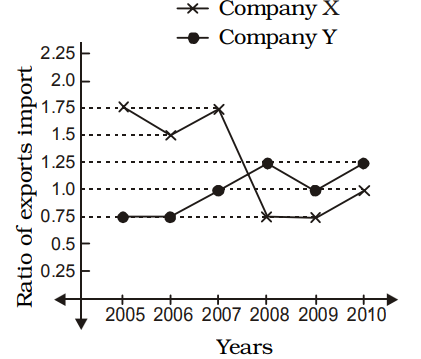
If the imports of company X in 2007 were increased by 40%, what would be the ratio of exports to the increased imports?
413 063a555ecbe1dca1b35d20e06
63a555ecbe1dca1b35d20e06 - 11.25true
- 21.75false
- 30.25false
- 40.75false
- Show Answer
- Workspace
- SingleChoice