Data Interpretation Questions Practice Question and Answer
8 Q:Directions : Read the graph and answer the following questions.
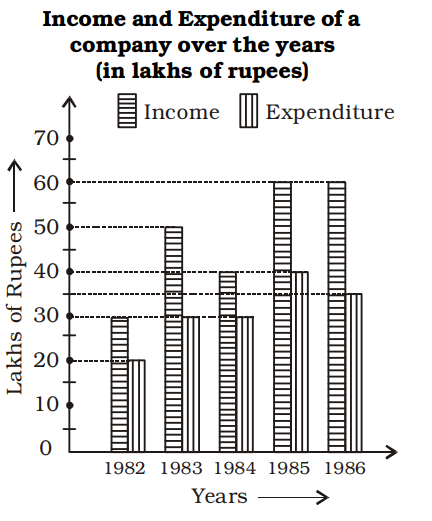
The number of years in which the income is more than the average income of the given years is
432 06461029dc899b466f4459a5c
6461029dc899b466f4459a5c- 1Onefalse
- 2Twofalse
- 3Threetrue
- 4Fourfalse
- Show Answer
- Workspace
- SingleChoice
Answer : 3. "Three"
Q:Direction: Read the following graph carefully and answer the following questions:
The following bar graph shows the quantity(in kg) of wheat, rice, pulses and salts sold by two companies P and Q in the month of January.
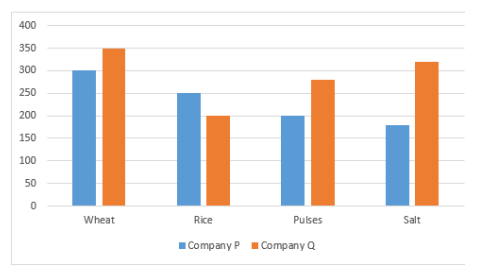
The total quantity of wheat, rice, pulses and salts sold by company P is approximately what percentage more or less than the total quantities sold by company Q?
430 064ddf46580ef1e74b4f17a7c
64ddf46580ef1e74b4f17a7cThe following bar graph shows the quantity(in kg) of wheat, rice, pulses and salts sold by two companies P and Q in the month of January.
- 122% morefalse
- 225% lessfalse
- 315% morefalse
- 412% lessfalse
- 519% moretrue
- Show Answer
- Workspace
- SingleChoice
Answer : 5. "19% more"
Q:Directions : The bar graph, given here, shows the demand and production of colour televisions of five companies for Diwali season in the year 2009. Study the graph carefully and answer the questions based on the graph.
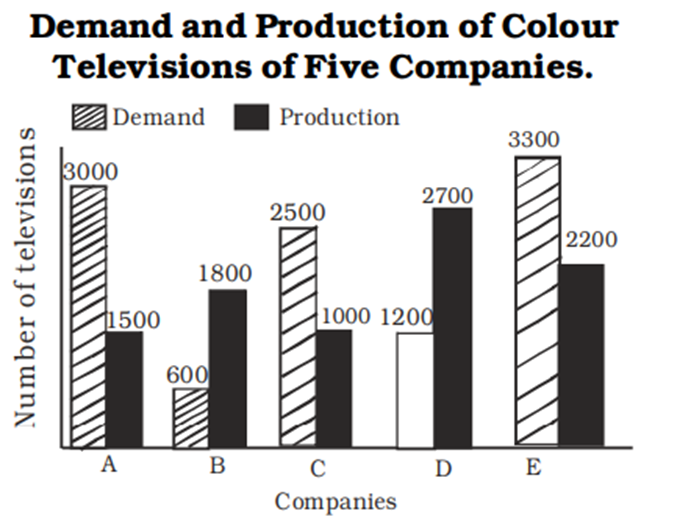
The ratio of companies having more demand than production of colour televisions to those having more production than demand is :
430 06461004c4f2cce984334e61f
6461004c4f2cce984334e61f- 12 : 3false
- 24 : 1false
- 31 :4false
- 43 : 2true
- Show Answer
- Workspace
- SingleChoice
Answer : 4. "3 : 2"
Q:Directions: The following pie chart show proportion of population of seven villages in 2009. Stud the pie chart and answer question that follows:
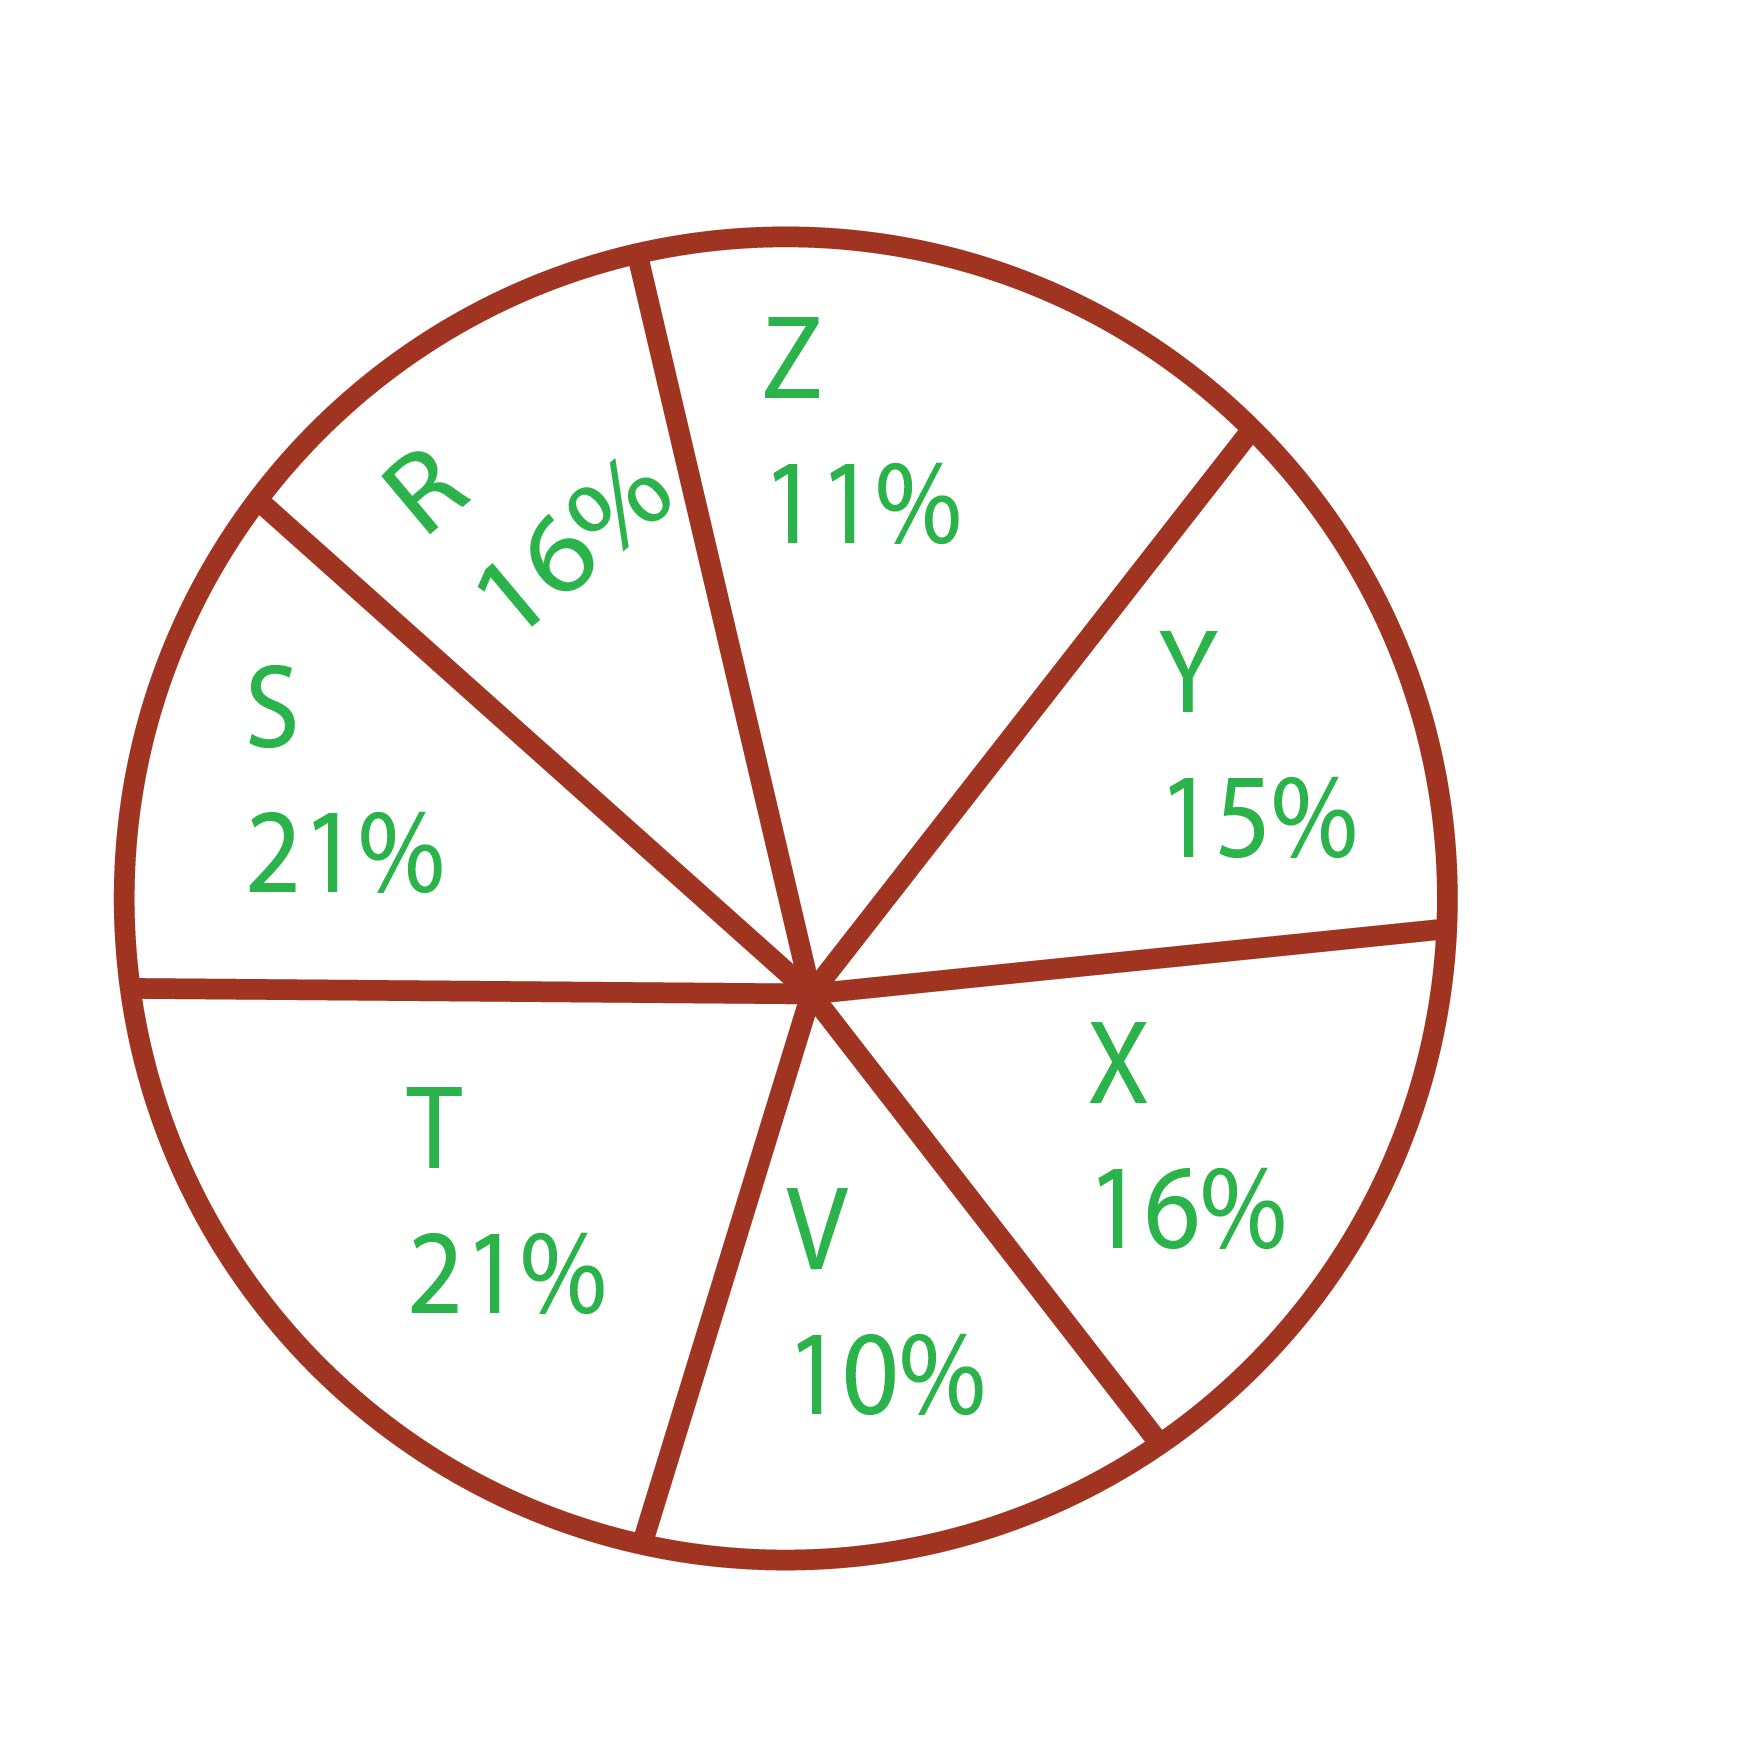
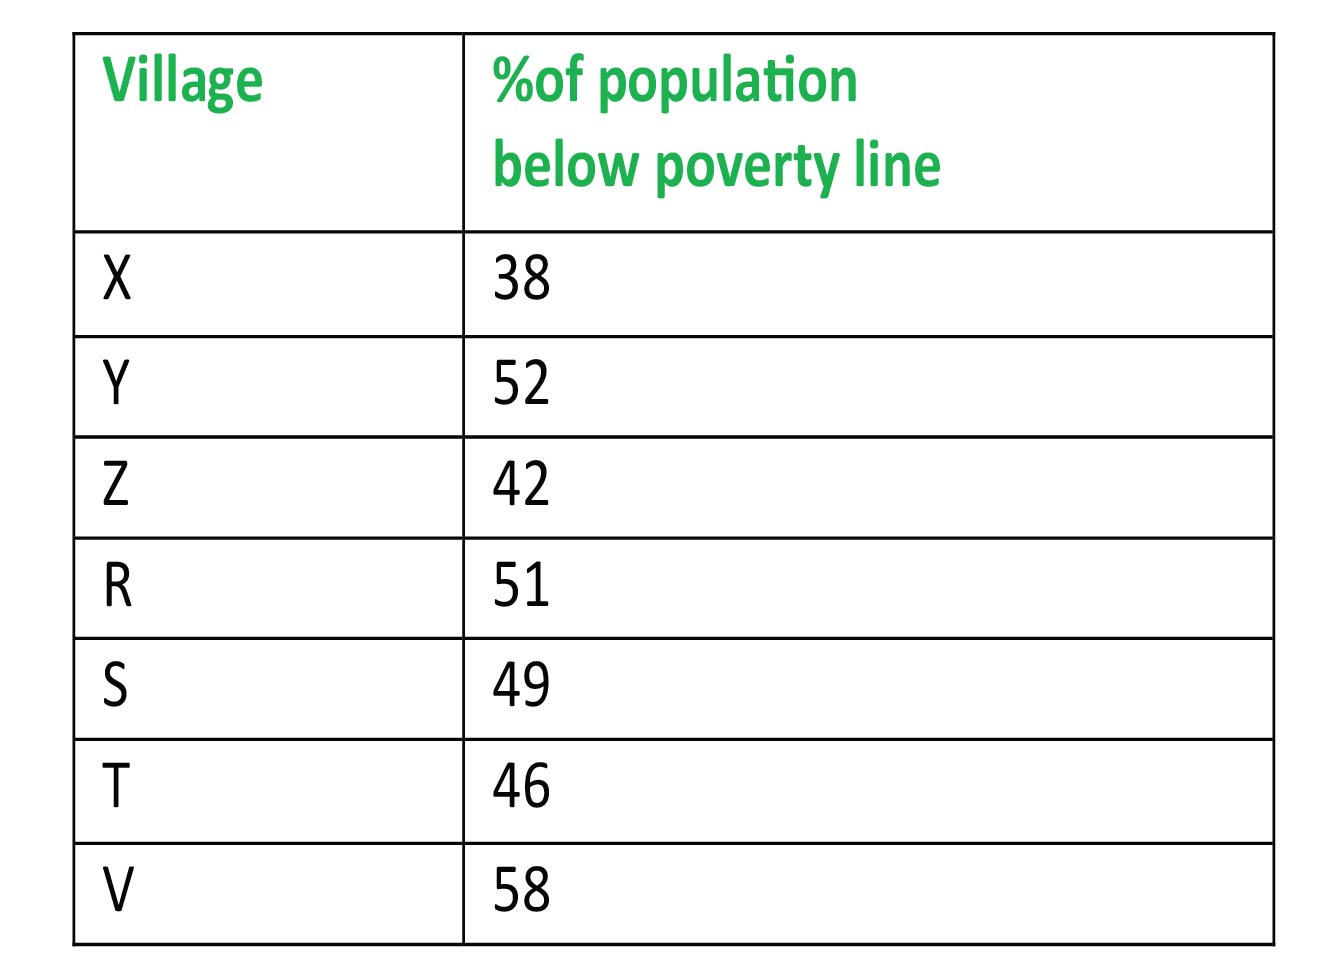
If the below poverty line population of the village 'X' is 12160, then the population of village 'S' is
424 0640876443218fd8d147bda90
640876443218fd8d147bda90- 118500false
- 220500false
- 322000true
- 420000false
- Show Answer
- Workspace
- SingleChoice
Answer : 3. "22000"
Q:Direction: Read the following table carefully and answer the following questions: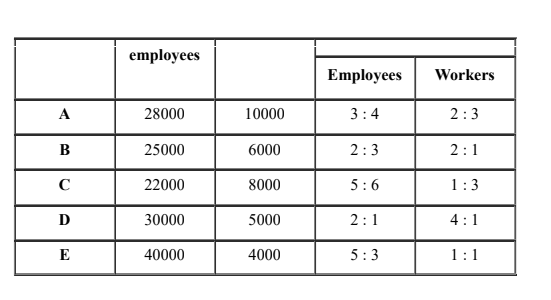
What is the ratio between the number of female workers and female employees of five companies?
424 064d4e3a5d02c5c746bdce983
64d4e3a5d02c5c746bdce983- 11 : 5false
- 21 : 4true
- 32 : 5false
- 41 : 3false
- 52 : 3false
- Show Answer
- Workspace
- SingleChoice
Answer : 2. "1 : 4"
Q:Direction: Study the following line graph carefully and answer the questions given below.
In the below line graph, the number of animals in two zoo A and B in the years – 2001, 2003, 2005 and 2007 is given.
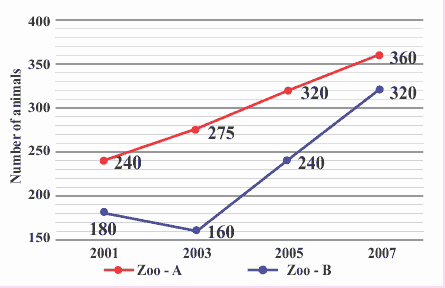
Sum of the number of animals in zoo-B in the years 2001, 2003 and 2005 together is what per cent more/less than the sum of the number of animals in zoo-A in the years 2001 and 2007 together?
422 064e5dc21640c09b72f94d305
64e5dc21640c09b72f94d305In the below line graph, the number of animals in two zoo A and B in the years – 2001, 2003, 2005 and 2007 is given.
- 1false
- 2false
- 3true
- 4false
- 5None of thesefalse
- Show Answer
- Workspace
- SingleChoice
Answer : 3. "
Q:Directions: Study the following information carefully and answer the questions given below.
In the table, the percentage of shirts (formal and casual) sold out of the total number of shirts sold in the week and the number of casual shirts sold data related to the number of shirts sold on ve weekdays – Monday, Tuesday, Wednesday, Thursday and Friday are given.
Total number of shirts sold in the week = x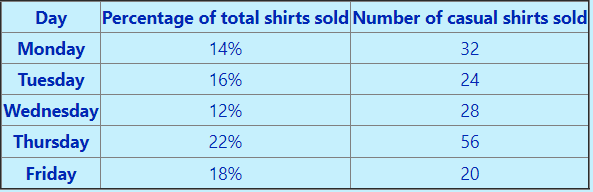 Note: Total number of shirts sold on Saturday and Sunday together = 72
What is the sum of the formal shirts sold on Monday, Tuesday and Wednesday together?
422 064e5edc9d928d8b7160e3c6a
64e5edc9d928d8b7160e3c6aIn the table, the percentage of shirts (formal and casual) sold out of the total number of shirts sold in the week and the number of casual shirts sold data related to the number of shirts sold on ve weekdays – Monday, Tuesday, Wednesday, Thursday and Friday are given.
Note: Total number of shirts sold on Saturday and Sunday together = 72- 1102false
- 2168false
- 384true
- 464false
- 5None of thesefalse
- Show Answer
- Workspace
- SingleChoice
Answer : 3. "84"
Q:Directions : The Bar Graph given here shows the population (in crores) of India in various census years. Observe the graph and answer the question based on it.
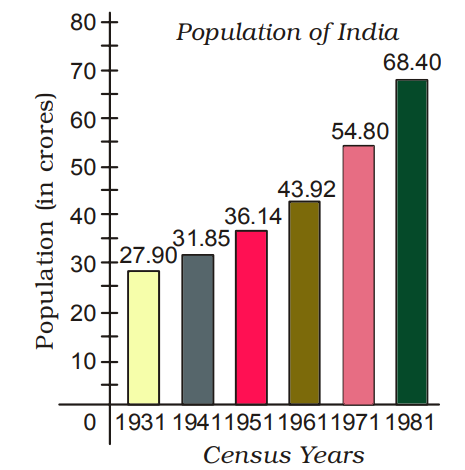
In which census year, the per cent increase in population is highest as compared to that in the previous census year?
422 06453a943613f9f6e3315cfe5
6453a943613f9f6e3315cfe5- 11951false
- 21961false
- 31971false
- 41981true
- Show Answer
- Workspace
- SingleChoice