Data Interpretation Questions Practice Question and Answer
8 Q:Directions: Study the following information carefully and answer the questions given below.
In the table, the percentage of shirts (formal and casual) sold out of the total number of shirts sold in the week and the number of casual shirts sold data related to the number of shirts sold on ve weekdays – Monday, Tuesday, Wednesday, Thursday and Friday are given.
Total number of shirts sold in the week = x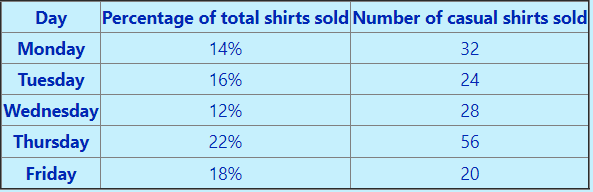 Note: Total number of shirts sold on Saturday and Sunday together = 72
What is the ratio of the number of casual shirts sold on Monday and Wednesday together and a number of formal shirts sold on Tuesday and Thursday together?
443 064e5ee61d928d8b7160e3e25
64e5ee61d928d8b7160e3e25In the table, the percentage of shirts (formal and casual) sold out of the total number of shirts sold in the week and the number of casual shirts sold data related to the number of shirts sold on ve weekdays – Monday, Tuesday, Wednesday, Thursday and Friday are given.
Note: Total number of shirts sold on Saturday and Sunday together = 72- 14 : 3false
- 23: 4false
- 35 : 3false
- 46: 5false
- 5None of thesetrue
- Show Answer
- Workspace
- SingleChoice
Answer : 5. "None of these "
Q:Directions: Study the following bar graph carefully to answer the questions.
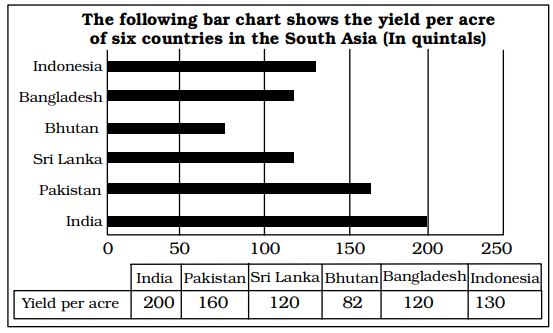
If the yield per acre is arranged in ascending order, then what is the difference between the yield per acre of first three countries and last three countries?
442 06464a417c899b466f44ffcd4
6464a417c899b466f44ffcd4- 1168 quintalstrue
- 2172 quintalsfalse
- 3182 quintalsfalse
- 4190 quintalsfalse
- Show Answer
- Workspace
- SingleChoice
Answer : 1. "168 quintals "
Q:Directions: The following pie chart show proportion of population of seven villages in 2009. Stud the pie chart and answer question that follows:
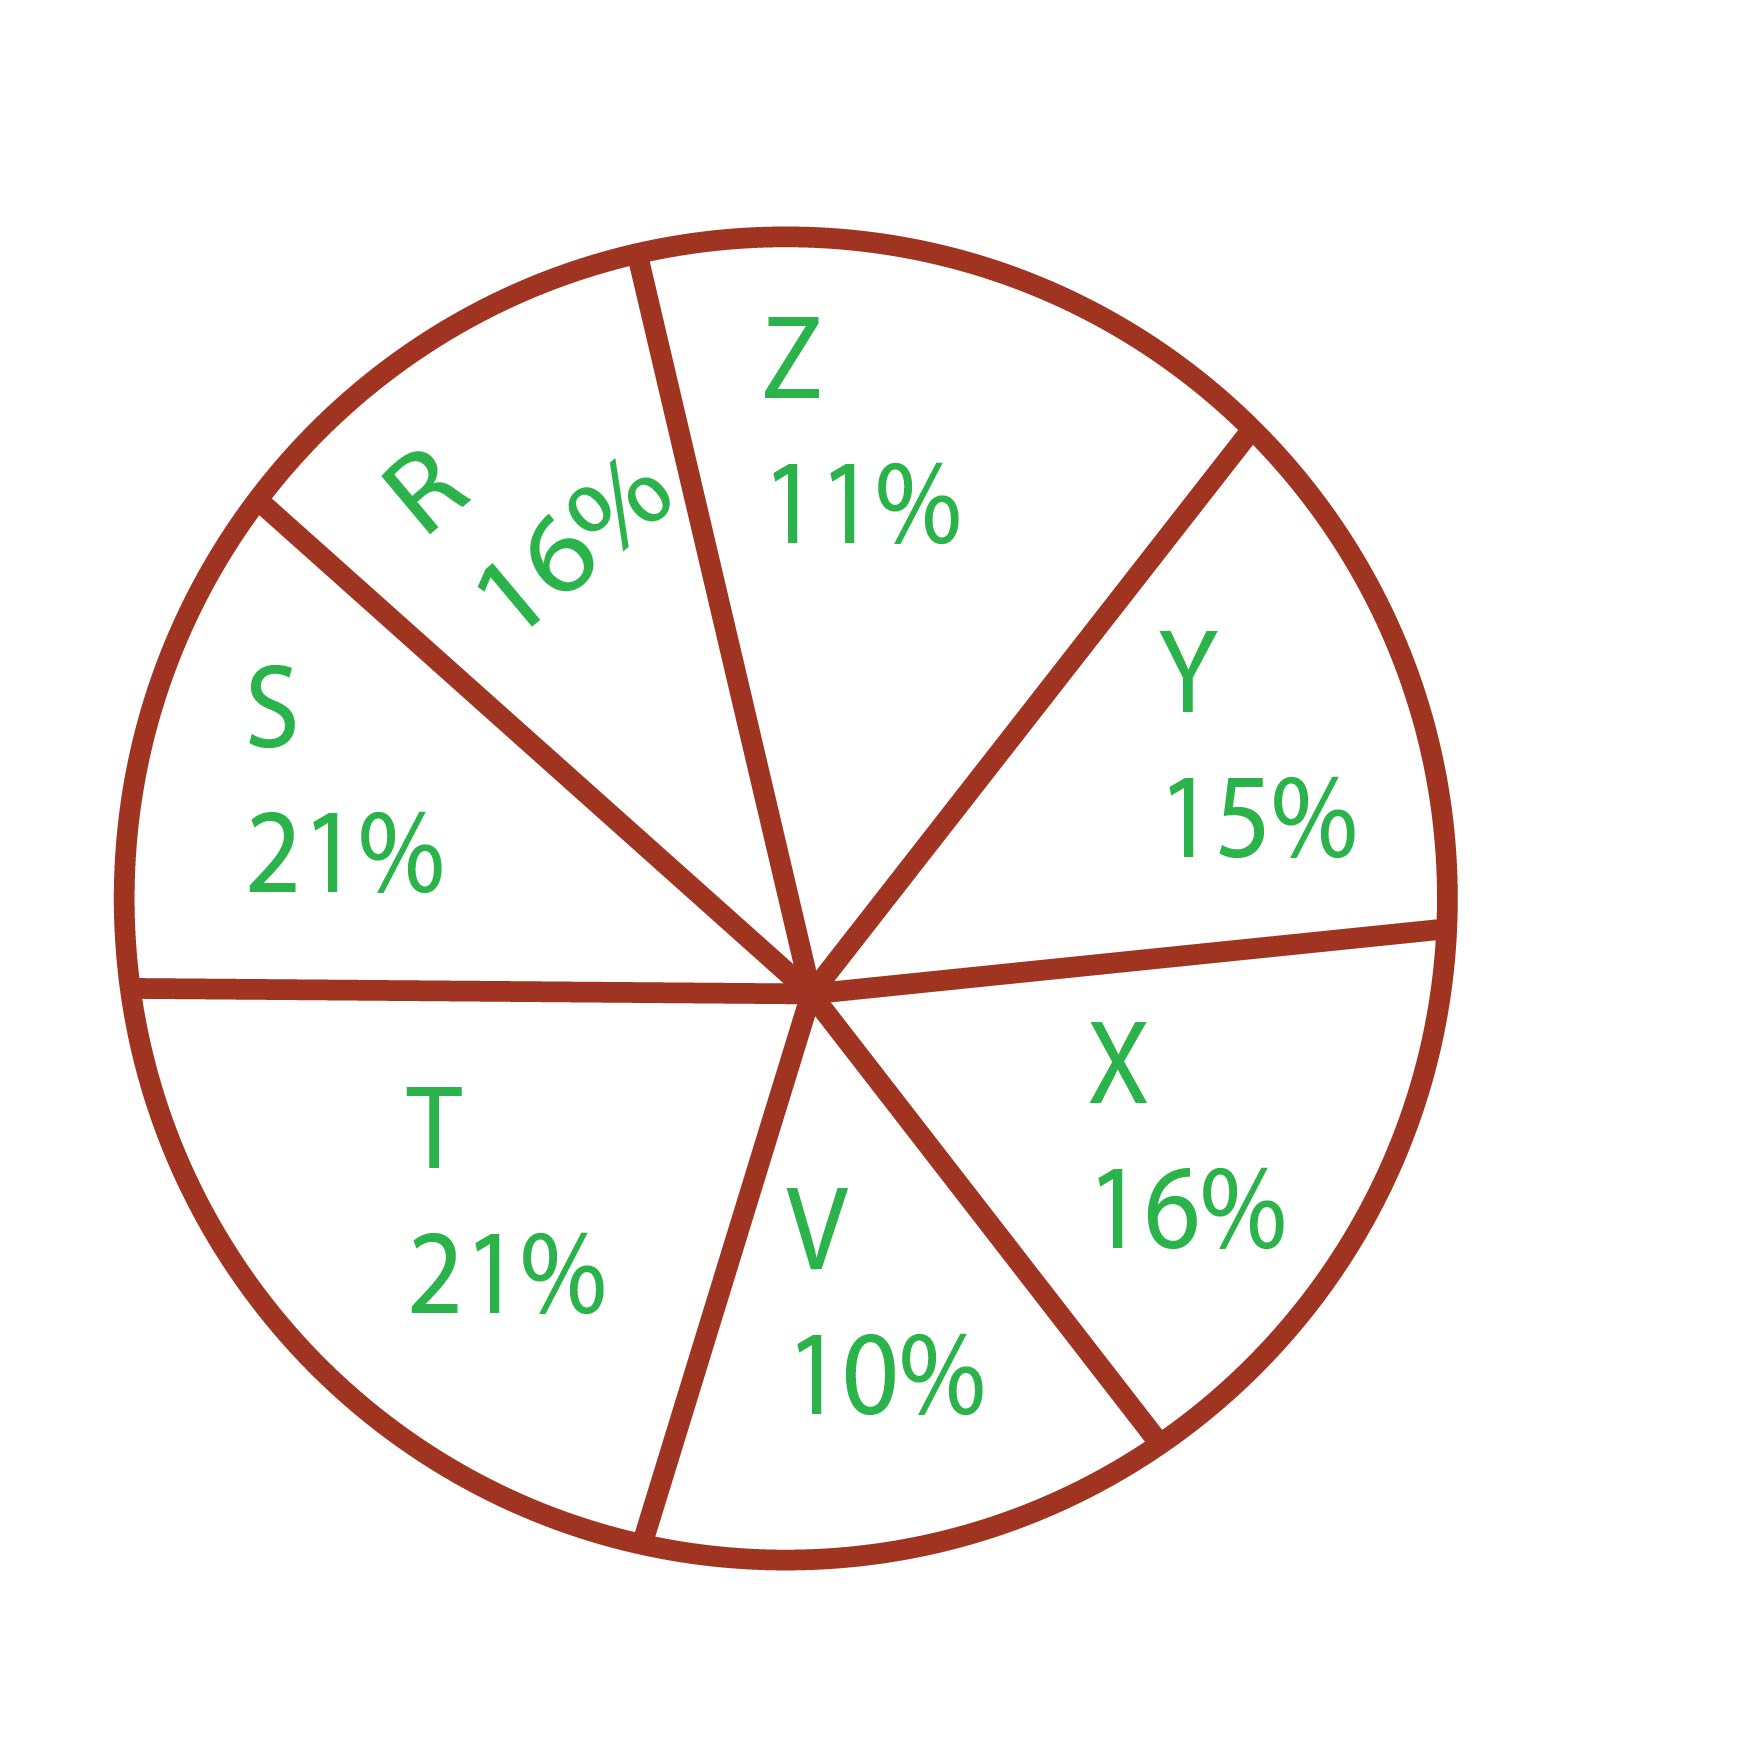
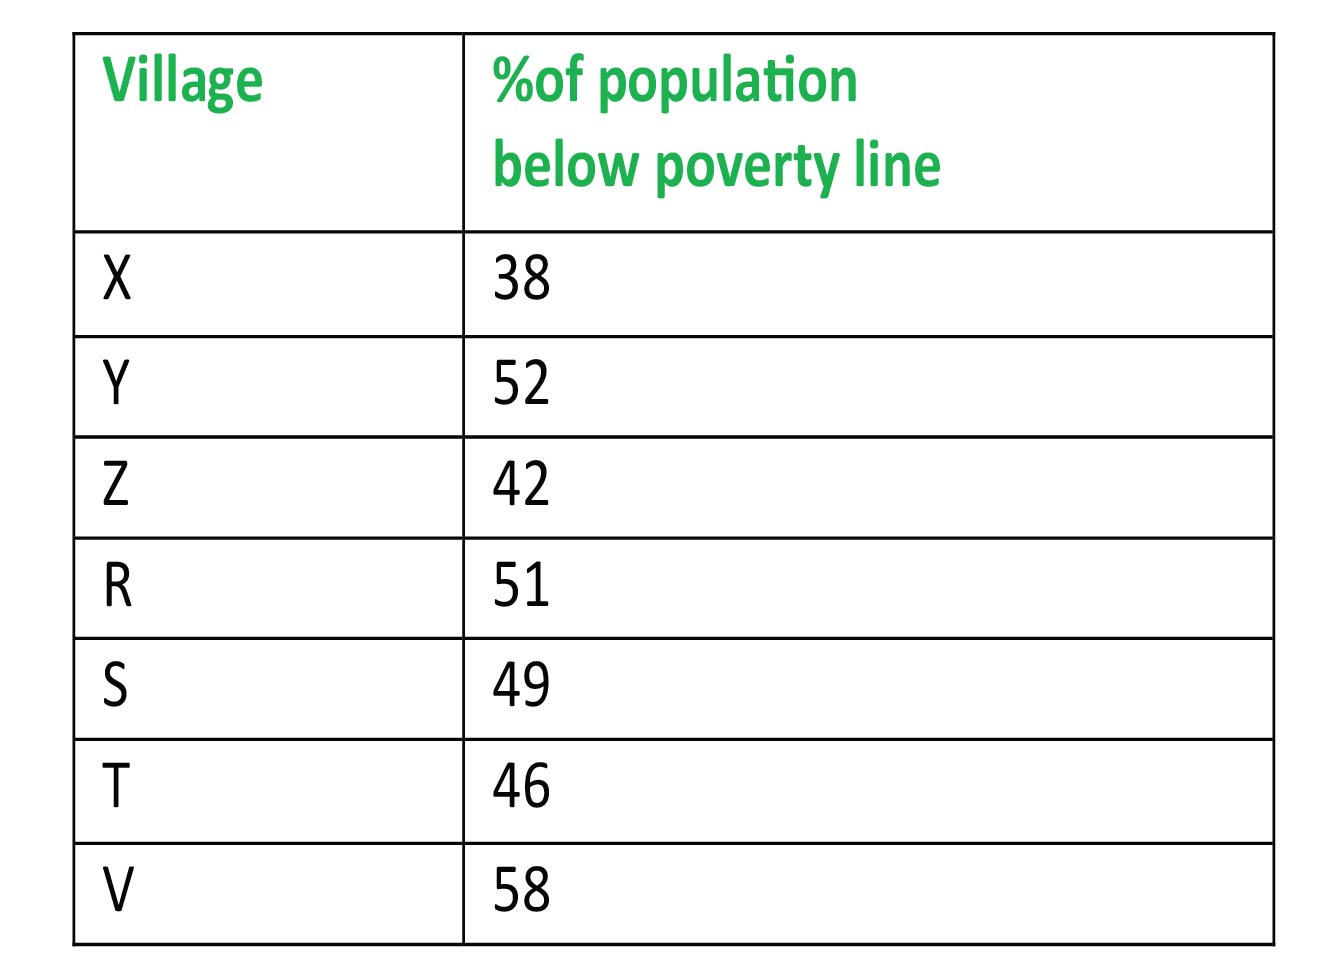
The ratio of the below poverty line population of village 'T' to that of the below poverty line population of village 'Z' is
441 06408769836c856ead7990286
6408769836c856ead7990286- 111: 23false
- 213: 11false
- 323: 11true
- 411:13false
- Show Answer
- Workspace
- SingleChoice
Answer : 3. "23: 11"
Q:Directions : Read the graph and answer the following questions.
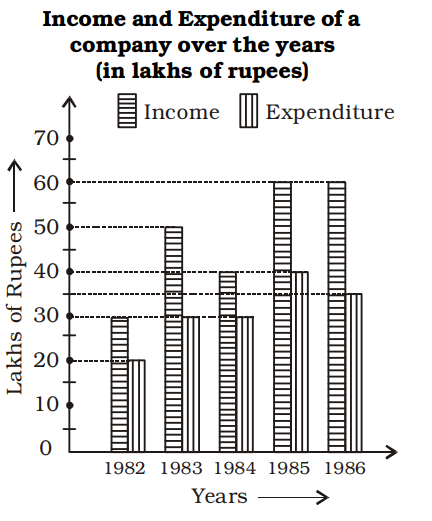
The number of years in which the income is more than the average income of the given years is
441 06461029dc899b466f4459a5c
6461029dc899b466f4459a5c- 1Onefalse
- 2Twofalse
- 3Threetrue
- 4Fourfalse
- Show Answer
- Workspace
- SingleChoice
Answer : 3. "Three"
Q:Directions: The bar diagram given below shows the productions (in the unit of thousand pieces) of three types of biscuits by a company in the five consecutive years. Study the diagram and answer the following questions.
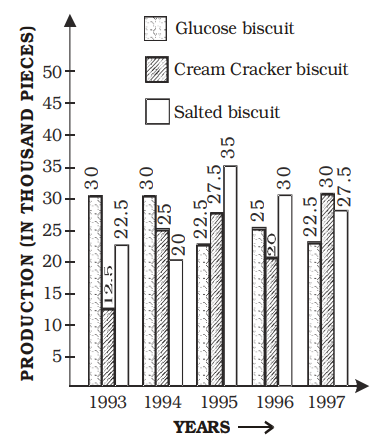
The percentage drop in the number of glucose biscuits manufactured from 1994 to 1995 is
441 064899ea4f4063d472f4a9ec8
64899ea4f4063d472f4a9ec8- 110%false
- 215%false
- 325%true
- 420%false
- Show Answer
- Workspace
- SingleChoice
Answer : 3. "25% "
Q:Directions: The bar diagram given below shows the productions (in the unit of thousand pieces) of three types of biscuits by a company in the five consecutive years. Study the diagram and answer the following questions.
The difference (in the unit of thousand pieces) between the total number of cream cracker biscuits manufactured in the years 1993, 1995 and 1997 and the total number of the biscuits of same type in the years 1994 and 1996 is
441 064899f09b90df94e034c42f4
64899f09b90df94e034c42f4- 115false
- 225true
- 330false
- 420false
- Show Answer
- Workspace
- SingleChoice
Answer : 2. "25 "
Q:Directions : Study the following pie chart carefully and answer the questions. The pie chart represents the percentage of people involved in various occupations.
Total number of people = 20000
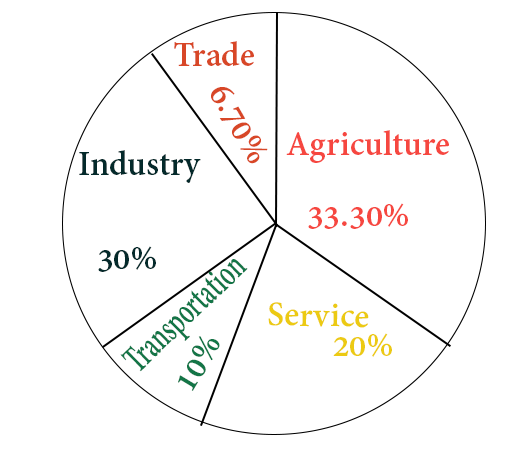
The sectoral angle made by the people involved in service in the given pie-chart is
437 06453a4ef56b58a42369ad85f
6453a4ef56b58a42369ad85fTotal number of people = 20000
- 136°false
- 290°false
- 372°true
- 4108°false
- Show Answer
- Workspace
- SingleChoice
Answer : 3. "72°"
Q:Directions: The sub divided bar diagram given below depicts Higher secondary Students of a school for three years. Study the diagram and answer the questions

The percentage passed in 1st division in 2008 was
435 0645ce5b945f1450a80b9e89d
645ce5b945f1450a80b9e89d- 127%false
- 232%false
- 3false
- 4true
- Show Answer
- Workspace
- SingleChoice