Data Interpretation Questions Practice Question and Answer
8 Q:Directions: The pie– chart shows the proposed outlay for different sectors during a Five–Year plan of Government of India. Total outlay is Rs. 40,000 crores. By reading the pie–chart answer the following three questions.
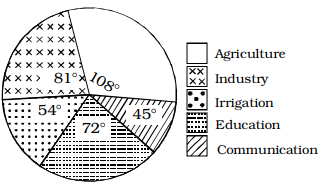
If the proposed outlay of Irrigation is x% of the proposed outlay of Agriculture, then x is equal to
457 06489a4b6f4063d472f4ac0dd
6489a4b6f4063d472f4ac0dd- 150%true
- 215%false
- 325%false
- 475%false
- Show Answer
- Workspace
- SingleChoice
Answer : 1. "50% "
Q:Direction: Study the following line graph carefully and answer the questions given below.
In the below line graph, the number of animals in two zoo A and B in the years – 2001, 2003, 2005 and 2007 is given.
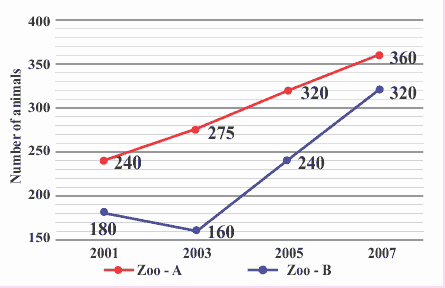
What is the sum of the differences of the number of animals in zoo-A and zoo-B in the years 2001, 2003 and 2005?
450 064e5dac2d928d8b7160df487
64e5dac2d928d8b7160df487In the below line graph, the number of animals in two zoo A and B in the years – 2001, 2003, 2005 and 2007 is given.
- 1185false
- 2235false
- 3255true
- 4275false
- 5None of thesefalse
- Show Answer
- Workspace
- SingleChoice
Answer : 3. "255"
Q:Directions: Student’s strength of a college in Arts, Science and Commerce from 2004-05 to 2007- 08 sessions are shown in the following bar graph. Study the graph and answer the questions
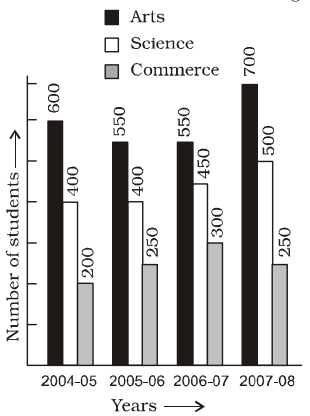
The ratio of average number of students in Arts to the average number of students in Commerce is
450 063f35c75aa2a114c952ed6bb
63f35c75aa2a114c952ed6bb- 112 : 5true
- 210 : 7false
- 37 : 4false
- 448 : 35false
- Show Answer
- Workspace
- SingleChoice
Answer : 1. "12 : 5 "
Q:Directions: Study the Bar diagram carefully and answer the questions.
The Bar diagram shows the trends of foreign direct investment (FDI) into India from all over the World (in Rs. crores).
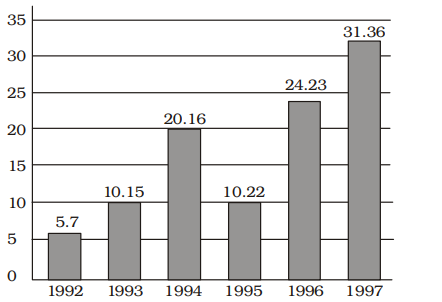
The year which exhibited the 2nd highest growth percentage in FDI in India over the period shown is
449 063a56a668fc9692134068b08
63a56a668fc9692134068b08 - 11993false
- 21994false
- 31997false
- 41996true
- Show Answer
- Workspace
- SingleChoice
Answer : 4. "1996"
Q:Directions: The sub divided bar diagram given below depicts Higher secondary Students of a school for three years. Study the diagram and answer the questions

The number of students passed with 3rd division in the year 2008 was
449 0645ce82d4d91510a5da93b1f
645ce82d4d91510a5da93b1f- 150false
- 260true
- 370false
- 480false
- Show Answer
- Workspace
- SingleChoice
Answer : 2. "60 "
Q:Directions : The bar graph, given here, shows the demand and production of colour televisions of five companies for Diwali season in the year 2009. Study the graph carefully and answer the questions based on the graph.
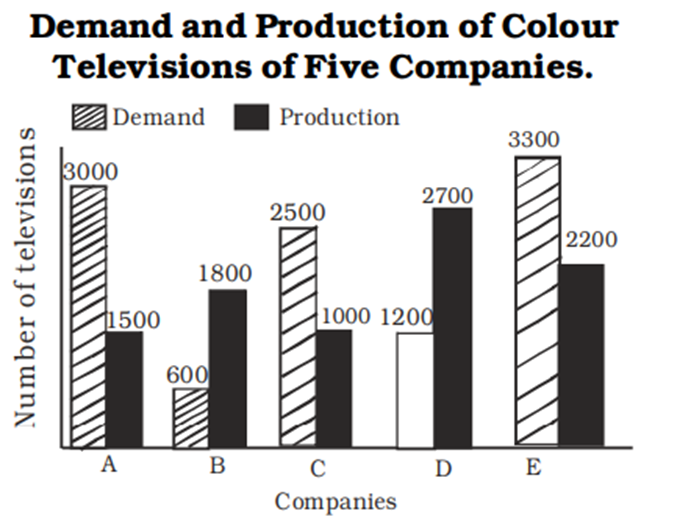
The demand of colour televisions of company B is appoximately what per cent of that of company C ?
448 06460f985cdae930acb746845
6460f985cdae930acb746845- 160%false
- 225%false
- 324%true
- 46%false
- Show Answer
- Workspace
- SingleChoice
Answer : 3. "24% "
Q:Direction: Read the following table carefully and answer the following questions:
Table shows the percentage of male and female employees in different education in a company and total number of males and females:
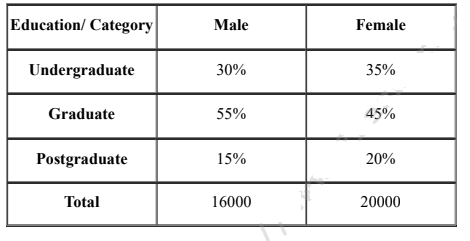
Find the ratio between the number of female and male employees of postgraduate.
447 064e751fe3be218b6cdc7ecd6
64e751fe3be218b6cdc7ecd6- 11 : 1false
- 22 : 3false
- 33 : 2false
- 45 : 3true
- 54 : 3false
- Show Answer
- Workspace
- SingleChoice
Answer : 4. "5 : 3"
Q:Direction: Read the following table carefully and answer the following questions: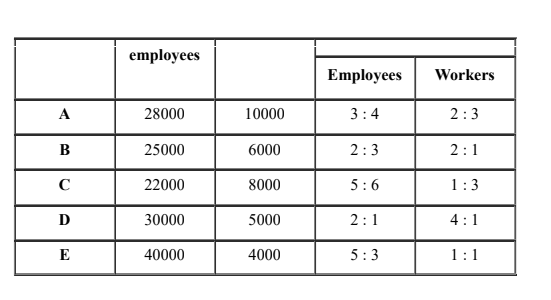
The male workers are approximately what percent of the total workers of five companies?
447 064d4e85280ef1e74b4d412c9
64d4e85280ef1e74b4d412c9- 145%false
- 242%false
- 338%false
- 452%false
- 548%true
- Show Answer
- Workspace
- SingleChoice