Data Interpretation Questions Practice Question and Answer
8 Q:Directions: Study the following bar graph carefully to answer the questions.
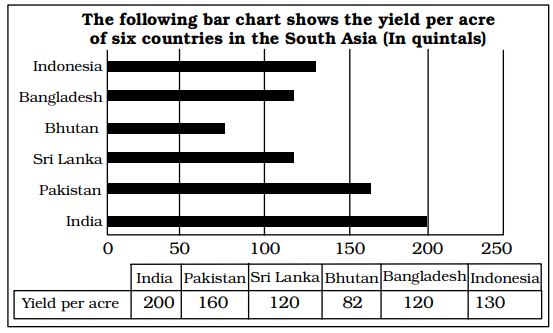
The yield per acre produced by Bangladesh is what percent of the total yield per acre produced by all countries?
466 06464a562c899b466f4501a21
6464a562c899b466f4501a21- 114%false
- 213.5%false
- 314.8%true
- 416%false
- Show Answer
- Workspace
- SingleChoice
Answer : 3. "14.8% "
Q:Directions: Degree- wise breakup of employees working in various department of an organisation and the ratio to men to women.
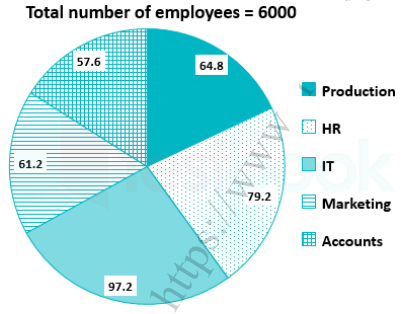
Respective ratio of men to women in each department
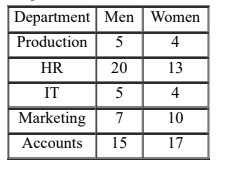
What is the total number of women working in the organisation?
465 064da0531e0ce5574969ef19a
64da0531e0ce5574969ef19a- 12450false
- 22830true
- 32520false
- 42480false
- 53320false
- Show Answer
- Workspace
- SingleChoice
Answer : 2. "2830"
Q:Directions : The bar graph, given here, shows the demand and production of colour televisions of five companies for Diwali season in the year 2009. Study the graph carefully and answer the questions based on the graph.
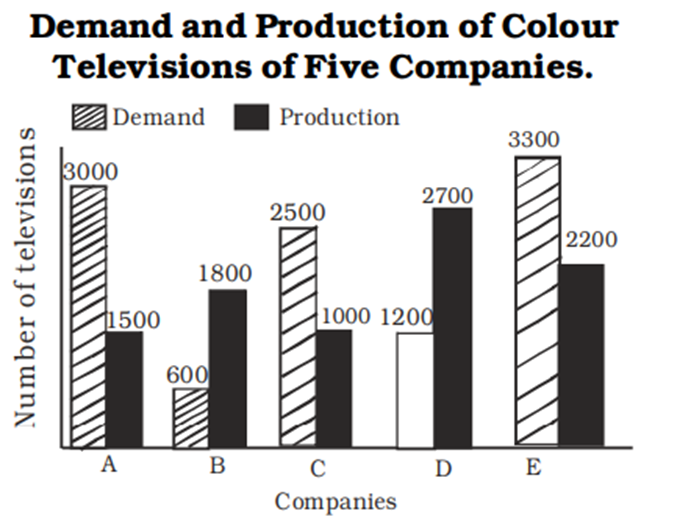
The production of colour televisions of company D is how many times that of company A ?
462 06460fa324f2cce984334e301
6460fa324f2cce984334e301- 11.9false
- 21.8true
- 31.5false
- 42.3false
- Show Answer
- Workspace
- SingleChoice
Answer : 2. "1.8 "
Q:Directions: The bar diagram given below shows the productions (in the unit of thousand pieces) of three types of biscuits by a company in the five consecutive years. Study the diagram and answer the following questions.
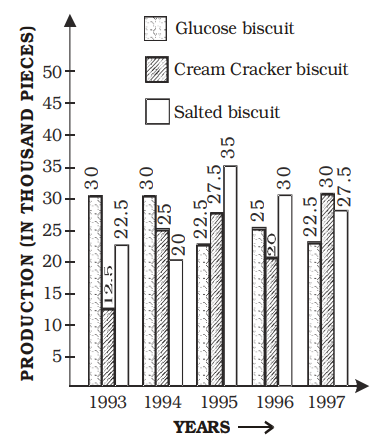
Total production of all the three types of biscuits was the least in the year
460 064899fa923e51f4777206be8
64899fa923e51f4777206be8- 11993true
- 21997false
- 31996false
- 41995false
- Show Answer
- Workspace
- SingleChoice
Answer : 1. "1993 "
Q:Directions: Read the pie chart carefully and answer the following questions.
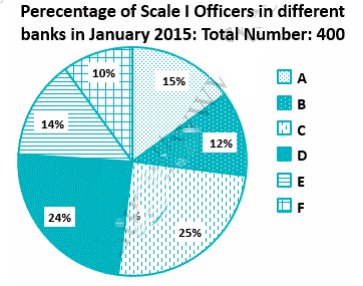
Note: No new employees joined the given banks of left the given banks from January 2015 to December 2015.
What is the average number of scales I officers in Banks D, E and F?
459 064f1dda818913c5bfc72dcf9
64f1dda818913c5bfc72dcf9- 163false
- 265false
- 364true
- 467false
- 568false
- Show Answer
- Workspace
- SingleChoice
Answer : 3. "64"
Q:Direction: Study the given pie chart carefully and answer the following questions accordingly. Given pie chart shows the percentage of players taking part in six different games in an event.
Total number of Players = 1800
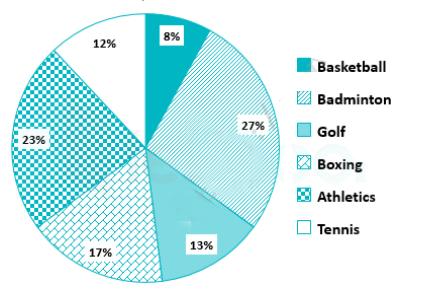
If the percentage of Golf players is increased by 50% and the percentage of Basketball players decreased by 25%, then what will be the new total number of Golf and Basketball players together?
459 064e75e0913f72deddceb359f
64e75e0913f72deddceb359f- 1390false
- 2379false
- 3459true
- 4480false
- 5None of thesefalse
- Show Answer
- Workspace
- SingleChoice
Answer : 3. "459"
Q:Directions : Study the following pie chart carefully and answer the questions. The pie chart represents the percentage of people involved in various occupations.
Total number of people = 20000
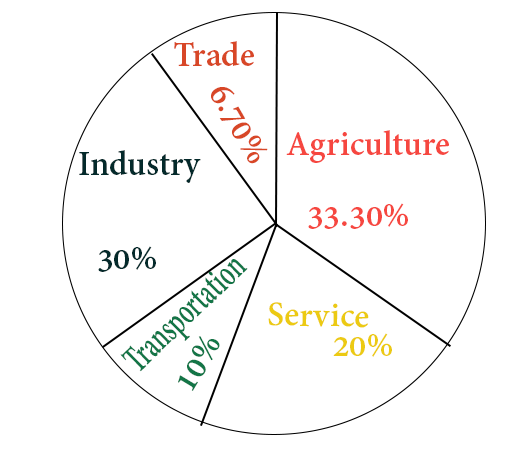
The ratio of the people involved in service to that in industry is
459 06453a49cf3618908bf5e16b4
6453a49cf3618908bf5e16b4Total number of people = 20000
- 11 : 2false
- 22 : 3true
- 33 : 4false
- 43 : 2false
- Show Answer
- Workspace
- SingleChoice
Answer : 2. "2 : 3 "
Q:Directions : Study the following graph and answer the questions.
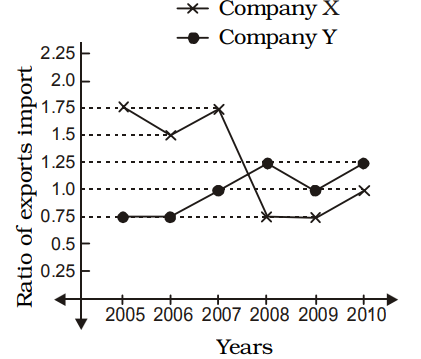
In 2005, the exports of company X were double that of company Y in that year. If the imports of company X during the year were 180 crores, what was the amount (in crore) of imports of company Y during the year?
456 063a5564424e8fb08b9fd64c7
63a5564424e8fb08b9fd64c7 - 1212false
- 2210true
- 3315false
- 4282false
- Show Answer
- Workspace
- SingleChoice