Data Interpretation Questions Practice Question and Answer
6 Q:Direction: The line chart given below shows number of labourers (men and women) working in six different years. Study the data carefully and answer the following questions.
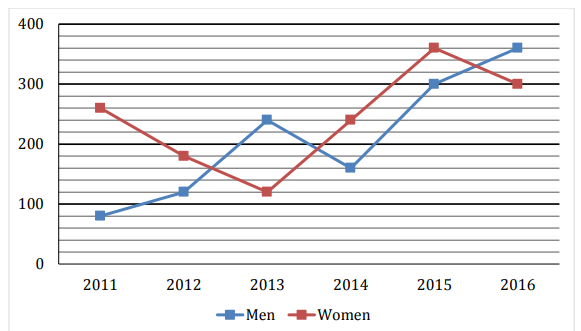
The average number of Women working in 2014, 2015 and 2016 together is how much more/less than average number of Men working in 2011, 2014 and 2016 together?
385 064d4b2f2a798377447221ad1
64d4b2f2a798377447221ad1- 1100true
- 280false
- 390false
- 470false
- 5None of the given optionsfalse
- Show Answer
- Workspace
- SingleChoice
Answer : 1. "100"
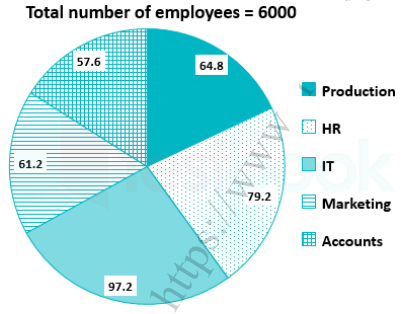
Q:Directions: Degree- wise breakup of employees working in various department of an organisation and the ratio to men to women.
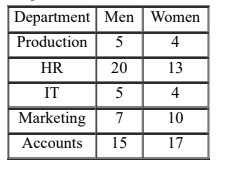
Respective ratio of men to women in each department
What is the respective ratio of the number of women working in the Marketing department and the number of men working in the Hr department?
382 064da032e462ecdc3adac5f0e
64da032e462ecdc3adac5f0e- 13 : 4true
- 24 : 5false
- 37 : 5false
- 44 : 7false
- 59 : 4false
- Show Answer
- Workspace
- SingleChoice
Answer : 1. "3 : 4"
Q:Directions : Study the following bar graph and answer the questions.
company (in lakhs of rupees) for the years 1994-1997:
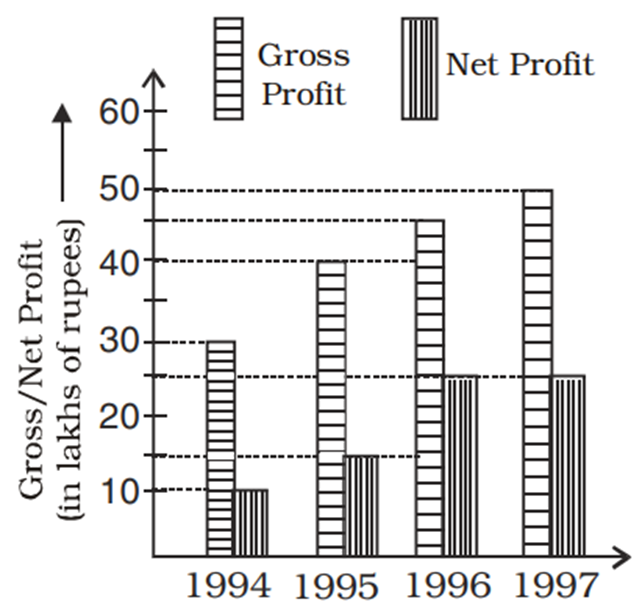
The percentage of net profit of 1995 as compared to the gross profit in that year is
378 06460f549c899b466f4458b03
6460f549c899b466f4458b03- 125.5%false
- 235.5%false
- 337.5%true
- 442.5%false
- Show Answer
- Workspace
- SingleChoice
Answer : 3. "37.5% "
Q:Direction: The line chart given below shows number of labourers (men and women) working in six different years. Study the data carefully and answer the following questions.
The total number of Men working in 2012 and 2013 together is what per cent of the total number of labourers (Men + Women) working in 2014?
372 064d4ad07ebd5c3747277b3a4
64d4ad07ebd5c3747277b3a4- 160%false
- 270%false
- 380%false
- 490%true
- 540%false
- Show Answer
- Workspace
- SingleChoice
Answer : 4. "90%"
Q:Direction: The line chart given below shows number of labourers (men and women) working in six different years. Study the data carefully and answer the following questions.
Find the ratio between total number of Labors working in 2012 and 2013 together to total number of labors working in 2015 and 2016 together.
370 064d4b4859ce88dacc34350c3
64d4b4859ce88dacc34350c3- 12: 1false
- 21: 2true
- 335: 66false
- 411: 10false
- 5None of the given optionsfalse
- Show Answer
- Workspace
- SingleChoice
Answer : 2. "1: 2"
Q:Directions : Study the following bar graph and answer the questions.
company (in lakhs of rupees) for the years 1994-1997:
The year in which the gross profit is double the net profit
349 06460f4e7c899b466f4458a0a
6460f4e7c899b466f4458a0a- 11997true
- 21995false
- 31996false
- 41994false
- Show Answer
- Workspace
- SingleChoice