Data Interpretation Questions Practice Question and Answer
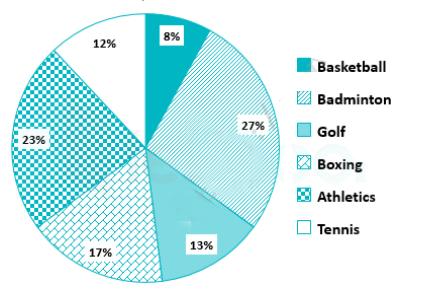
8 Q:Direction: Study the given pie chart carefully and answer the following questions accordingly. Given pie chart shows the percentage of players taking part in six different games in an event.
Total number of Players = 1800

If the percentage of Golf players is increased by 50% and the percentage of Basketball players decreased by 25%, then what will be the new total number of Golf and Basketball players together?
458 064e75e0913f72deddceb359f
64e75e0913f72deddceb359f
- 1390false
- 2379false
- 3459true
- 4480false
- 5None of thesefalse
- Show Answer
- Workspace
- SingleChoice
Answer : 3. "459"
Q:Direction: Read the following table carefully and answer the following questions:
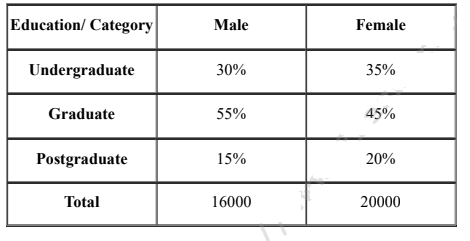
Table shows the percentage of male and female employees in different education in a company and total number of males and females:

The difference between Graduate female and male employees in the company.
559 064e752a0de1aa1b70fdeed48
64e752a0de1aa1b70fdeed48
- 1150false
- 2100false
- 3200true
- 4250false
- 5180false
- Show Answer
- Workspace
- SingleChoice
Answer : 3. "200"
Q:Direction: Read the following table carefully and answer the following questions:
Table shows the percentage of male and female employees in different education in a company and total number of males and females:

Find the number of Undergraduate male employees is approximately what percent less than the number of undergraduate female employees?
484 064e7524cd928d8b716136a79
64e7524cd928d8b716136a79
- 131%true
- 221%false
- 327%false
- 424%false
- 534%false
- Show Answer
- Workspace
- SingleChoice
Answer : 1. "31%"
Q:Direction: Read the following table carefully and answer the following questions:
Table shows the percentage of male and female employees in different education in a company and total number of males and females:

Find the ratio between the number of female and male employees of postgraduate.
446 064e751fe3be218b6cdc7ecd6
64e751fe3be218b6cdc7ecd6
- 11 : 1false
- 22 : 3false
- 33 : 2false
- 45 : 3true
- 54 : 3false
- Show Answer
- Workspace
- SingleChoice
Answer : 4. "5 : 3"
Q:Direction: Read the following table carefully and answer the following questions:
Table shows the percentage of male and female employees in different education in a company and total number of males and females:

Find the postgraduate employees of a company are approximately what percent of total employees of a company?
518 064e7516813f72deddceb0e95
64e7516813f72deddceb0e95
- 112%false
- 222%false
- 315%false
- 426%false
- 518%true
- Show Answer
- Workspace
- SingleChoice
Answer : 5. "18%"
Q:Direction: Read the following table carefully and answer the following questions:
Table shows the percentage of male and female employees in different education in a company and total number of males and females:

Find the average number of Undergraduate employees in a company.
492 064e750afde1aa1b70fdee97c
64e750afde1aa1b70fdee97c
- 16300false
- 26100false
- 35400false
- 45900true
- 56700false
- Show Answer
- Workspace
- SingleChoice
Answer : 4. "5900"
Q:Directions: Study the following information carefully and answer the questions given below.
In the table, the percentage of shirts (formal and casual) sold out of the total number of shirts sold in the week and the number of casual shirts sold data related to the number of shirts sold on ve weekdays – Monday, Tuesday, Wednesday, Thursday and Friday are given.
Total number of shirts sold in the week = x Note: Total number of shirts sold on Saturday and Sunday together = 72
The number of casual shirts sold on Thursday is what per cent more than the number of formal shirts sold on Tuesday?
543 064e5ef6460749cb6f2e5fffd
64e5ef6460749cb6f2e5fffdIn the table, the percentage of shirts (formal and casual) sold out of the total number of shirts sold in the week and the number of casual shirts sold data related to the number of shirts sold on ve weekdays – Monday, Tuesday, Wednesday, Thursday and Friday are given.
 Note: Total number of shirts sold on Saturday and Sunday together = 72
- 120%false
- 250%false
- 340%true
- 437.5%false
- 5None of thesefalse
- Show Answer
- Workspace
- SingleChoice
Answer : 3. "40%"
Q:Directions: Study the following information carefully and answer the questions given below.
In the table, the percentage of shirts (formal and casual) sold out of the total number of shirts sold in the week and the number of casual shirts sold data related to the number of shirts sold on ve weekdays – Monday, Tuesday, Wednesday, Thursday and Friday are given.
Total number of shirts sold in the week = x Note: Total number of shirts sold on Saturday and Sunday together = 72
40% of casual shirts sold and 25% of formal shirts sold on Friday of brand X, then the number of shirts sold of brands other than X on Friday is
393 064e5ef003be218b6cdc29ab1
64e5ef003be218b6cdc29ab1In the table, the percentage of shirts (formal and casual) sold out of the total number of shirts sold in the week and the number of casual shirts sold data related to the number of shirts sold on ve weekdays – Monday, Tuesday, Wednesday, Thursday and Friday are given.
 Note: Total number of shirts sold on Saturday and Sunday together = 72
- 121false
- 231false
- 341false
- 451true
- 5None of thesefalse
- Show Answer
- Workspace
- SingleChoice

