Data Interpretation Questions Practice Question and Answer
8 Q:Direction: Study the following table carefully to answer these questions.
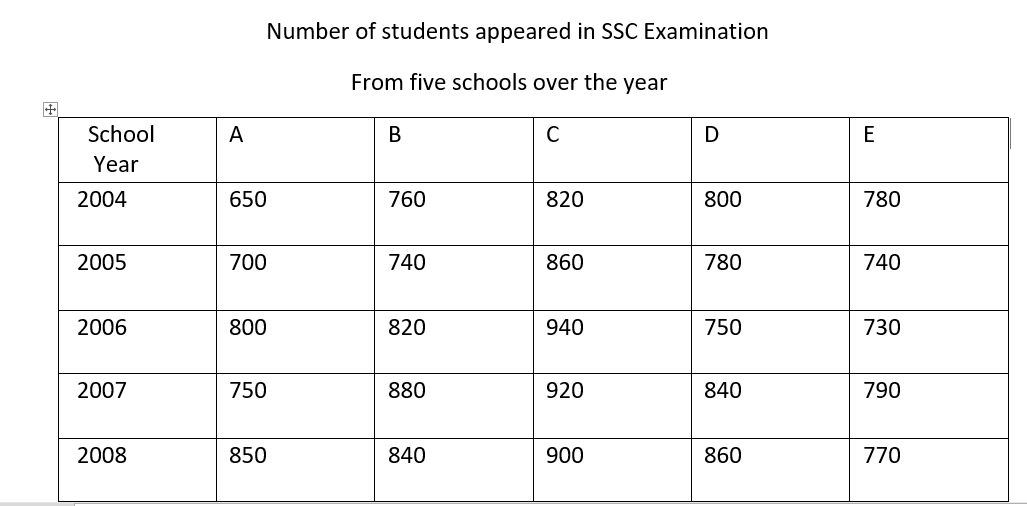
What is the average number of students appeared from school B for all the years ?
908 05e6c67550b8b1e6afc2acb83
5e6c67550b8b1e6afc2acb83- 1828false
- 2815false
- 3823false
- 4808true
- 5855false
- Show Answer
- Workspace
- SingleChoice
Answer : 4. "808"
Q:Directions: Study the following table carefully to answer the questions that follow .
Number of soldiers ( in thousands ) joining five different forces during six different.
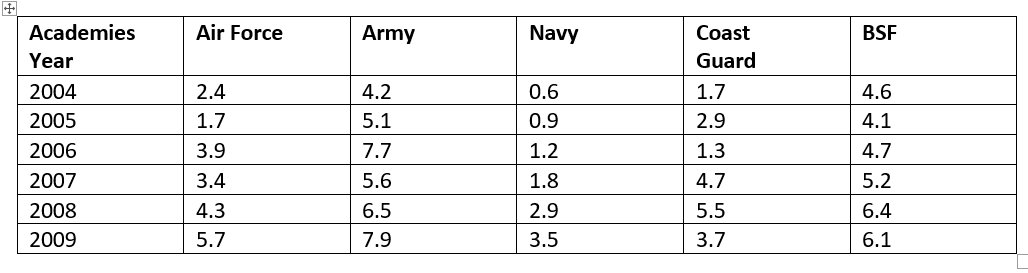
What was the average number of soldiers joining all the forces together in the year 2007?
907 05e82ebabd06376635697510a
5e82ebabd06376635697510aNumber of soldiers ( in thousands ) joining five different forces during six different.
- 14,620false
- 242,400false
- 34,260false
- 442,600false
- 5None of thesetrue
- Show Answer
- Workspace
- SingleChoice
Answer : 5. "None of these "
Q:Directions: The bar graph given below shows the production (in ' 000 tones) of rice of a country for the year 2007 to 2011. Study the graph carefully and answer the question given below it.
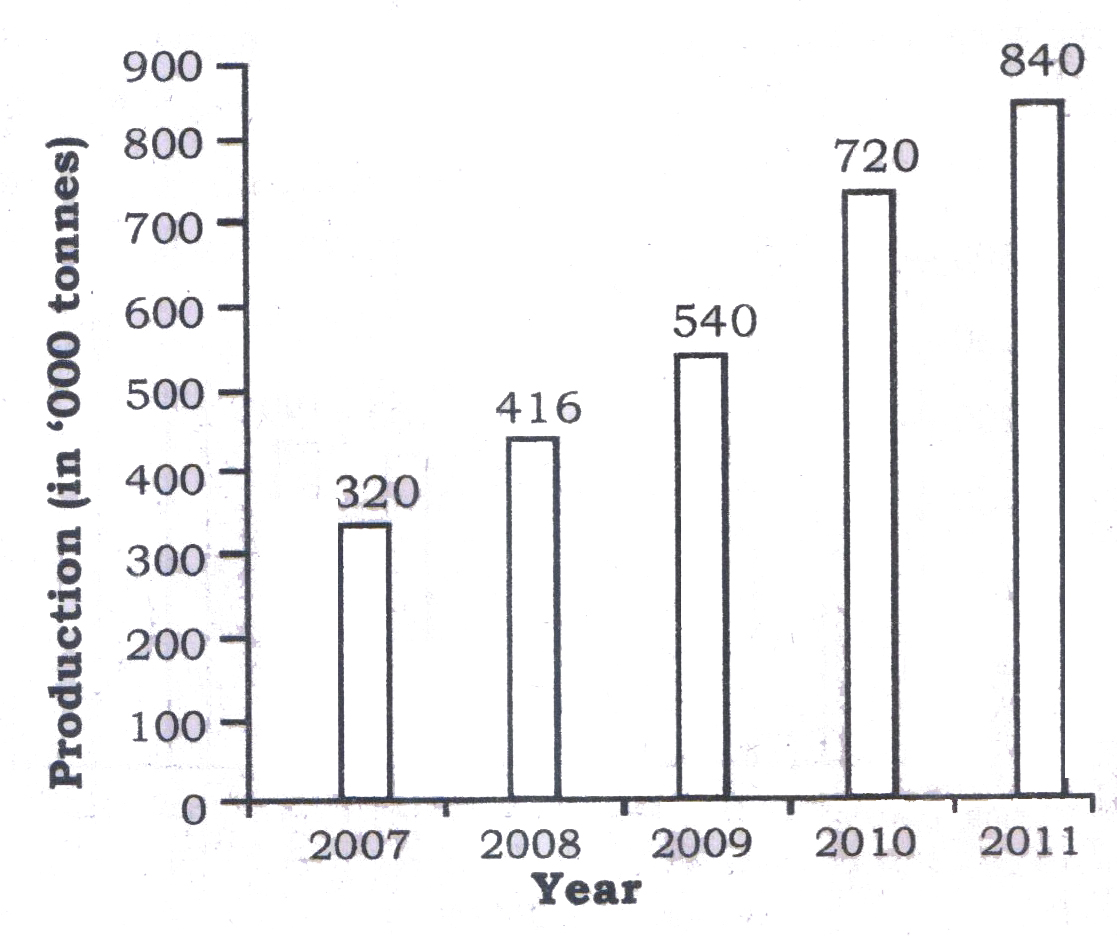
The production of rice in the year 2010 is how much percent more than the production of rice in the year 2009?
905 05e8186dcd56d695255db5657
5e8186dcd56d695255db5657- 121.5false
- 237.5false
- 342.5false
- 433.33true
- Show Answer
- Workspace
- SingleChoice
Answer : 4. "33.33 "
Q:Direction: Study the following information and answer the related questions. P, Q, R, S, T, A, B, C, D and E are employees of a company. A table shows the average age of any two employees of the company. The average age of A and B is 27.5.
i.e. average age of A & P is given as (A+P)/2=39.5
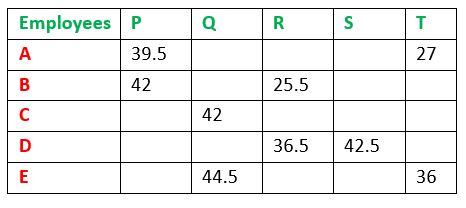
What is the ratio of ages of Q and E?
901 06062bc2accecc445217a7037
6062bc2accecc445217a7037i.e. average age of A & P is given as (A+P)/2=39.5
- 123: 25false
- 225: 23false
- 346: 43true
- 443: 46false
- 5None of thesefalse
- Show Answer
- Workspace
- SingleChoice
Answer : 3. "46: 43 "
Q:The following penalty diagram shows the 4 year exam results of the students of 10th standard. Study the diagram and answer the following questions.
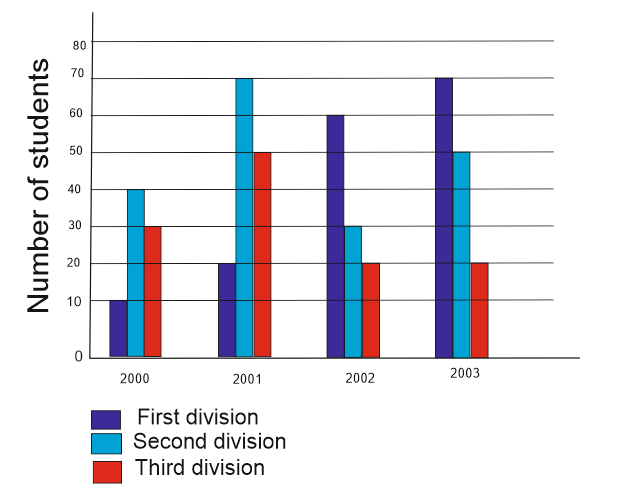
What is the ratio of the total students who have attained second division in the year 2000 and appeared in the examination?
899 05dd4def57780ee3551584a51
5dd4def57780ee3551584a51- 11:4true
- 21:3false
- 33:4false
- 41:2false
- Show Answer
- Workspace
- SingleChoice
Answer : 1. "1:4"
Q:Direction: Study the following information and answer the related questions. P, Q, R, S, T, A, B, C, D and E are employees of a company. A table shows the average age of any two employees of the company. The average age of A and B is 27.5.
i.e. average age of A & P is given as (A+P)/2=39.5
What is the age of T?
897 06062bb4b9cf7d827dcdcde5b
6062bb4b9cf7d827dcdcde5bi.e. average age of A & P is given as (A+P)/2=39.5
- 133false
- 239false
- 327false
- 429true
- 5None of thesefalse
- Show Answer
- Workspace
- SingleChoice
Answer : 4. "29 "
Q:Direction : The table given below represents number of bikes of five different brands sold from 2001- 2005, with the help of data given in the table, answer the following questions.
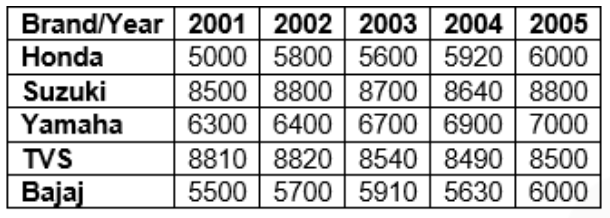
The average sale of Bajaj from 2001 to 2005 is what percentage of total sales of Suzuki from 2001-2005?
896 060a4ef29b33a50608a41f7ff
60a4ef29b33a50608a41f7ff- 114%false
- 213.23%true
- 312.22%false
- 415.23%false
- 5None of thesefalse
- Show Answer
- Workspace
- SingleChoice
Answer : 2. "13.23%"
Q:Direction: The following table represents the number of items sold by four divisions of a consumer goods dealer during 2010 to 2013.
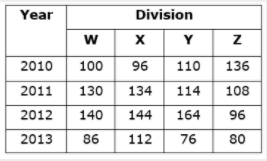
The combined sales figures in 2011 and 2013 of which division was the lowest?
896 0603750bfcd43d04a8f4b0fdd
603750bfcd43d04a8f4b0fdd- 1Yfalse
- 2Wfalse
- 3Ztrue
- 4Xfalse
- Show Answer
- Workspace
- SingleChoice